
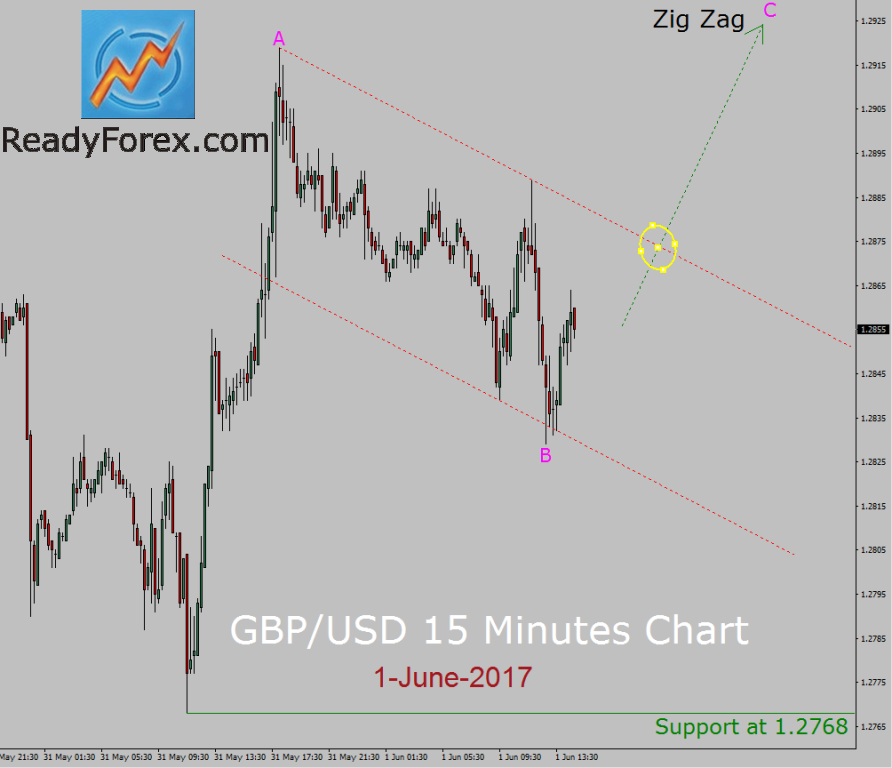
GBP/USD Elliott Wave Forecast: Bullish Zig Zag
The trend is bullish in GBP/USD currency pair, 15 minutes time frame. As I have suggested a few hours ago during my daily Live trading room session, the market is falling down on a short term basis to print a corrective Wave B Zig Zag Elliott wave pattern and traders should look for a sell trade. So, all those Forex traders who have followed my Elliott Wave analysis have made the right decision as the price has descended. Strong key support level is present at 1.2768 price level.
The price action in GBP/USD currency pair is now going to stop and reverse back up towards 1.2925 price area to print a bullish Elliott wave C leg which is going to complete a bullish Zig Zag Elliott wave pattern in the next coming trading hours.
Currently; the market is trying to rise up but we need to wait until bullish price action breaks out of red color bearish trend channel lines in 15 minutes time frame. In a case of a bullish breakout, a good idea is to look for a possible upcoming long trade to join an uptrend. However; if the price action of GBP/USD currency pair breaks below 1.2768, vital support level then I might like to stay out of the market and re-examine the fifteen minutes chart of GBP/USD currency pair.
(Click on image to enlarge)
Disclaimer: Forex trading involves significant risk of loss. The high degree of leverage can work against you as well as for you. The possibility exists that you could sustain a loss of some or all ...
more


Good zig zag pattern.