Forex Analysis Of USD/JPY For Thursday, July 12
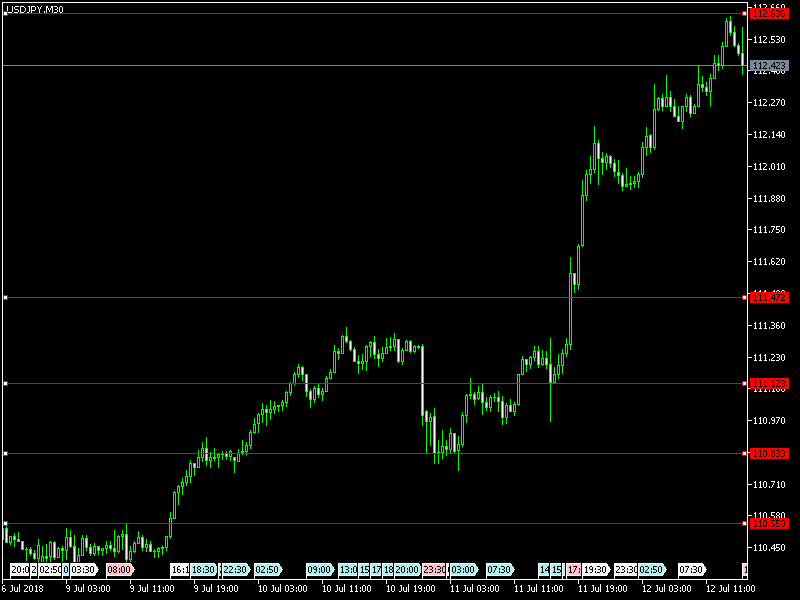
First, we look into the yesterday trade and what happened on July 11, 2018, and it opened at 110.999 and went high at 112.165 and gone low 110.758 and finally closed at 111.982. The calculated pivot point for the day is 111.635.
The difference between high and low was nearly 1.407 points and there was a good chance for a trader to take the opportunity between low to high levels and finally benefited. Now the opportunity is, from high to higher levels for few days due to dollar become strong and the trade war with China. If EUR/USD goes high USD/JPY goes down and vice versa and watch two pairs for trading before entering into the trade. For many days the range for this pair was between 109.360 to 112.165. Hourly traders are waiting for an opportunity to buy at 112.63, 112.90 levels or sell at 111.48, 111.10 and 110.83 to get maximum profit.
LEVELS TO BE WATCHED FOR TRADERS FOR THEIR TRADING
|
Level |
First Level |
Second Level |
Third Level |
|
Selling Level |
111.48 |
111.10 |
110.83 |
|
Buying Level |
112.63 |
112.90 |
113.28 |
EVENTS TO BE OBSERVED AT THESE TIMES TO TAKE MORE ADVANTAGE
|
GMT |
Event |
Previous |
|---|---|---|
|
12:30 |
USD FOMC Member Kashkari Speech |
|
|
12:30 |
USD Initial Jobless Claims |
231K |
|
12:30 |
USD Continuing Jobless Claims |
1.739M |
|
12:30 |
USD Consumer Price Index (MoM) |
0.2% |
|
12:30 |
USD Consumer Price Index n.s.a (MoM) |
251.588 |
|
12:30 |
USD Consumer Price Index Core s.a |
256.889 |
SEE THE LEVELS IN THE CHART AND TRADE ACCORDINGLY