Forex Analysis Of GBP/USD For Thursday, July 12
First, we look into the yesterday trade and what happened on July 11, 2018, and it opened at 1.32702 and went high at 1.32846 and gone low 1.31991 and finally closed at 1.32026. The calculated pivot point for the day is 1.32287
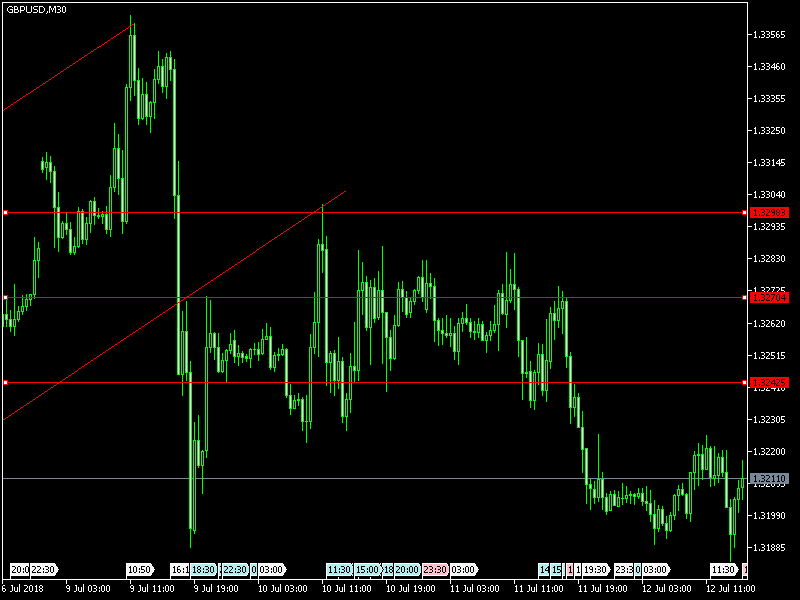
The difference between high and low was nearly 855 points and there was a fair chance for traders to take the opportunity and finally benefited. Now the opportunity is, the market is trying to go lower and consolidation levels for a few days. Hourly traders are waiting for an opportunity to buy at 1.3299, 1.3352, 1.3403 levels and sell at 1.3173, 1.3145 and 1.3080 levels, to get good profit. For many days, the pair was ranging from 1.3050 to 1.3350 levels and started moving lower levels due to dollar become strong and pressure of ECB minutes event. Traders should go for buy at support levels and sell at resistance levels.
TRADERS SHOULD OBSERVE AT THESE LEVELS FOR THEIR TRADING
|
Level |
First Level |
Second Level |
Third Level |
|
Selling Level |
1.3173 |
1.3145 |
1.3117 |
|
Buying Level |
1.3242 |
1.3270 |
1.3298 |
EVENTS TO BE OBSERVED BY TRADERS AT THESE TIMINGS AND TAKE ADVANTAGE
|
GMT |
Event |
Actual |
Previous |
|---|---|---|---|
|
24h |
EUR Eurogroup meeting |
||
|
08:30 |
GBP BOE Credit Conditions Survey |
||
|
09:00 |
EUR Industrial Production s.a. (MoM) |
1.3% |
-0.8% |
|
09:00 |
EUR Industrial Production w.d.a. (YoY) |
2.4% |
1.7% |
|
11:30 |
EUR ECB Monetary Policy Meeting Accounts |
||
|
12:30 |
USD FOMC Member Kashkari Speech |
||
|
12:30 |
USD Initial Jobless Claims |
231K |
|
|
12:30 |
USD Continuing Jobless Claims |
1.739M |
|
|
12:30 |
USD Consumer Price Index (MoM) |
0.2% |
|
|
12:30 |
USD Consumer Price Index n.s.a (MoM) |
251.588 |
SEE THE LEVELS IN THE CHART AND TRADE ACCORDINGLY