
EUR/USD Wedge Pattern Awaits Bearish Or Bullish Breakout
EUR/USD
4 hour
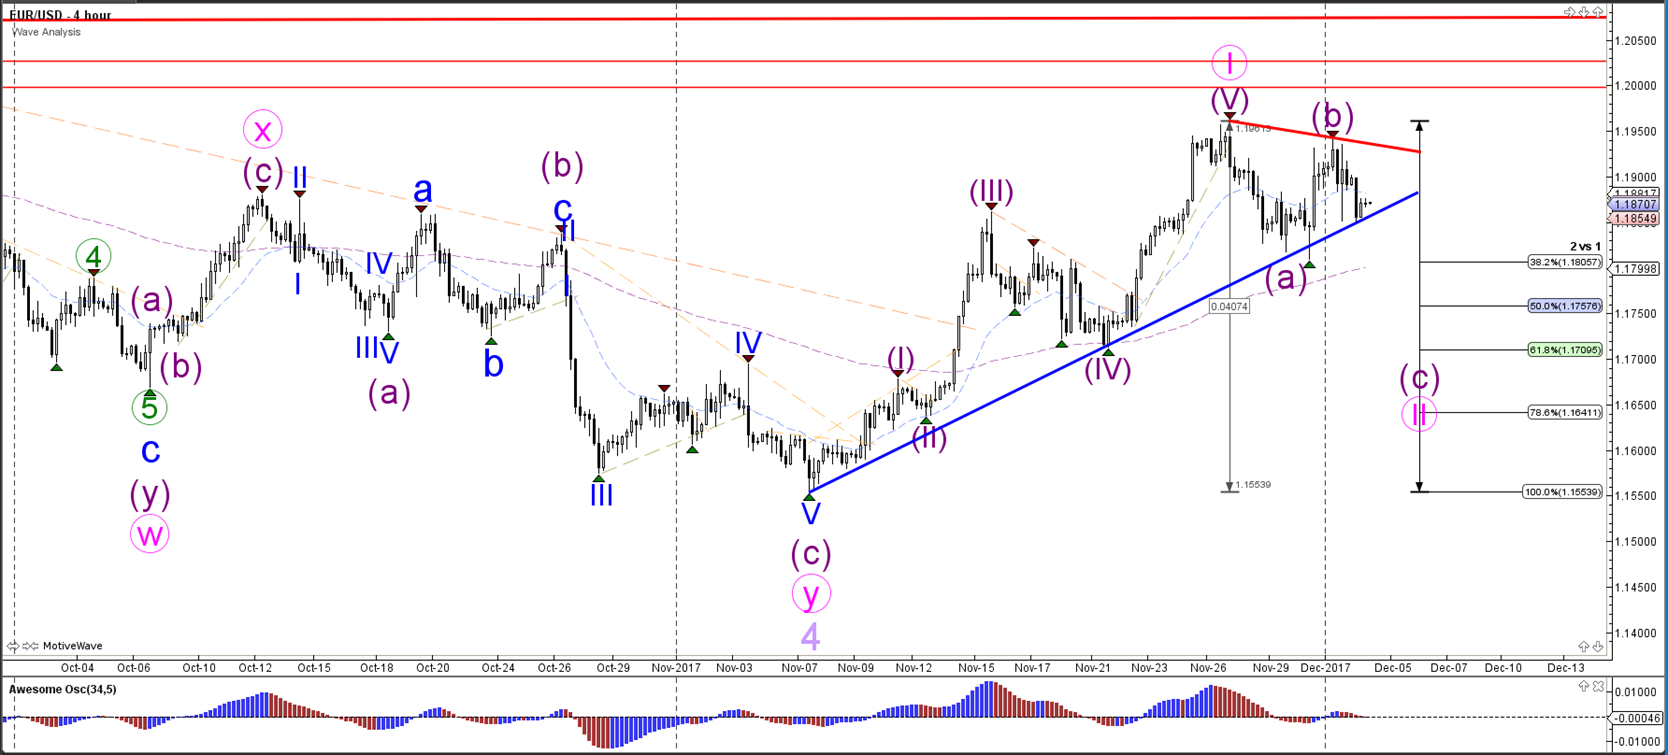
The EUR/USD could be in a wave B (purple) bearish retracement If price is able to break below the support trend line (blue). A bearish breakout could see price fall and challenge the Fibonacci levels of wave 2 vs 1 (pink).
1 hour
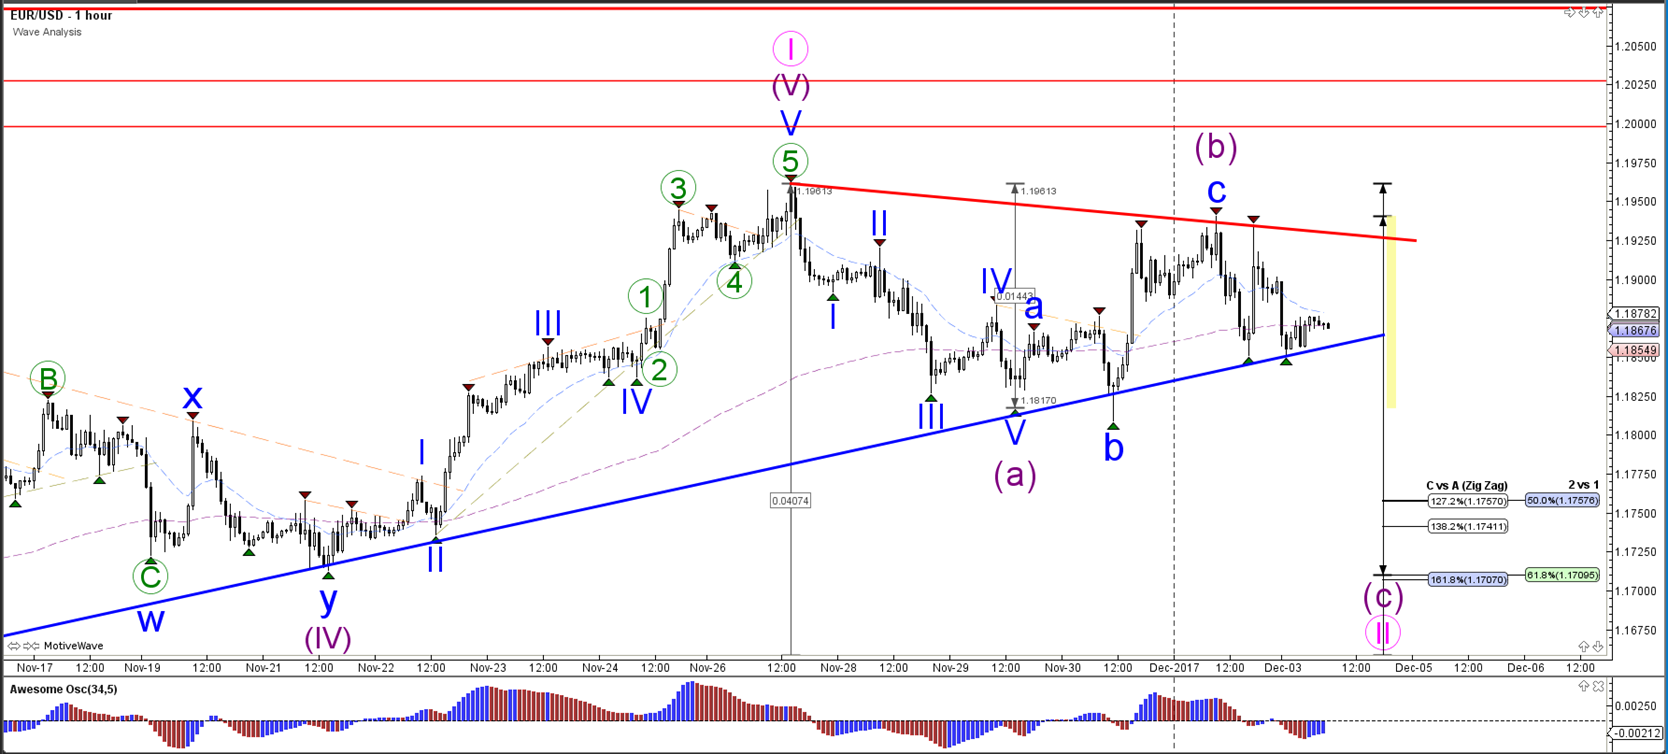
The EUR/USD break below support (blue) could see price fall towards the Fibonacci levels of wave 2 (pink). A break above the resistance trend line (red) could indicate an extension of wave 1 (pink), although new resistance levels are nearby (red lines).
USD/JPY
4 hour
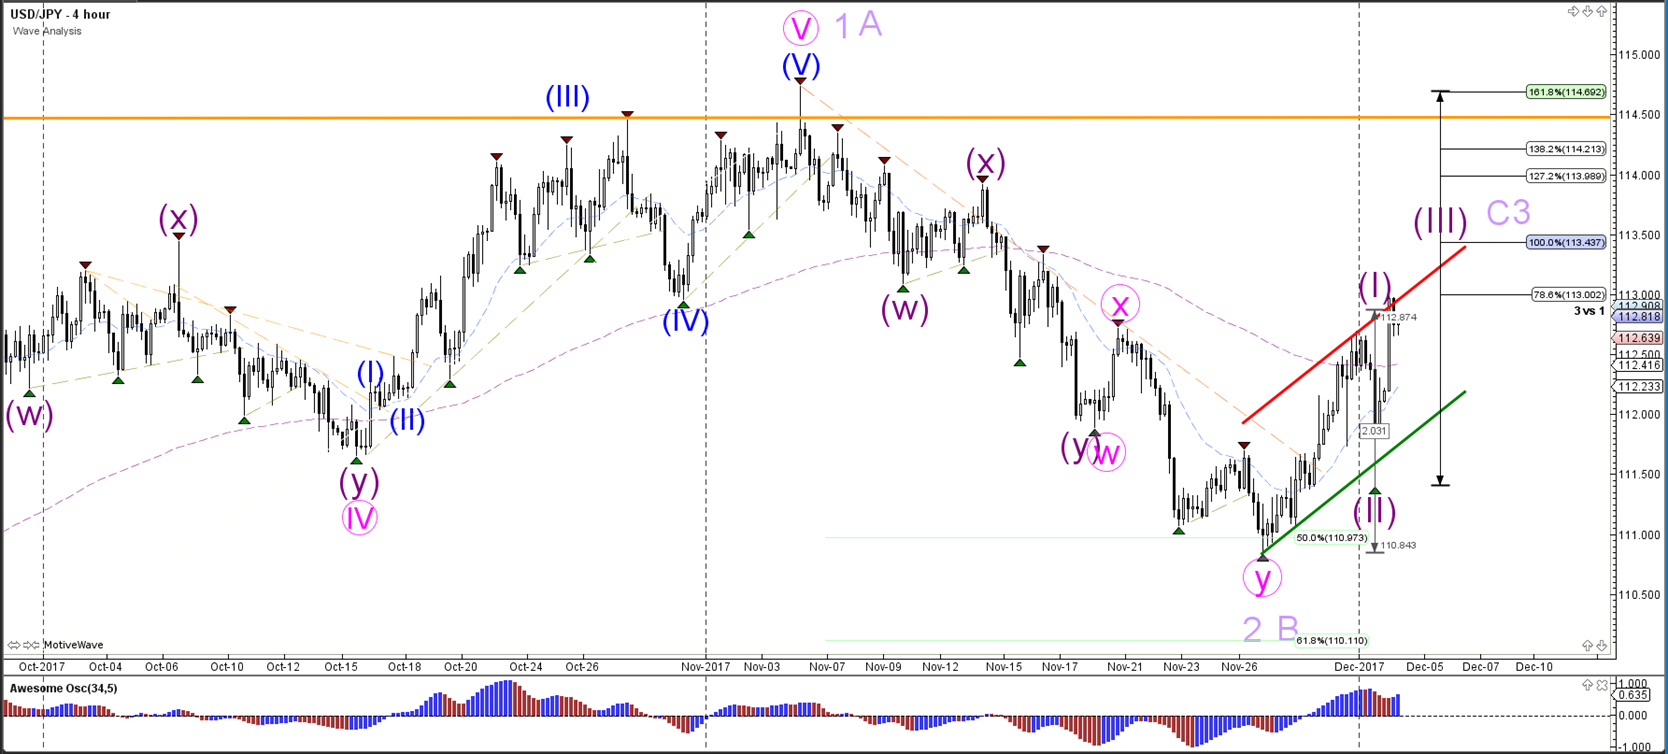
The USD/JPY has made another higher high within the uptrend channel and therefore a new bullish pattern (wave 3) seems more likely at the moment than an extended WXY correction within an uncompleted wave 2 or B (light purple).
1 hour
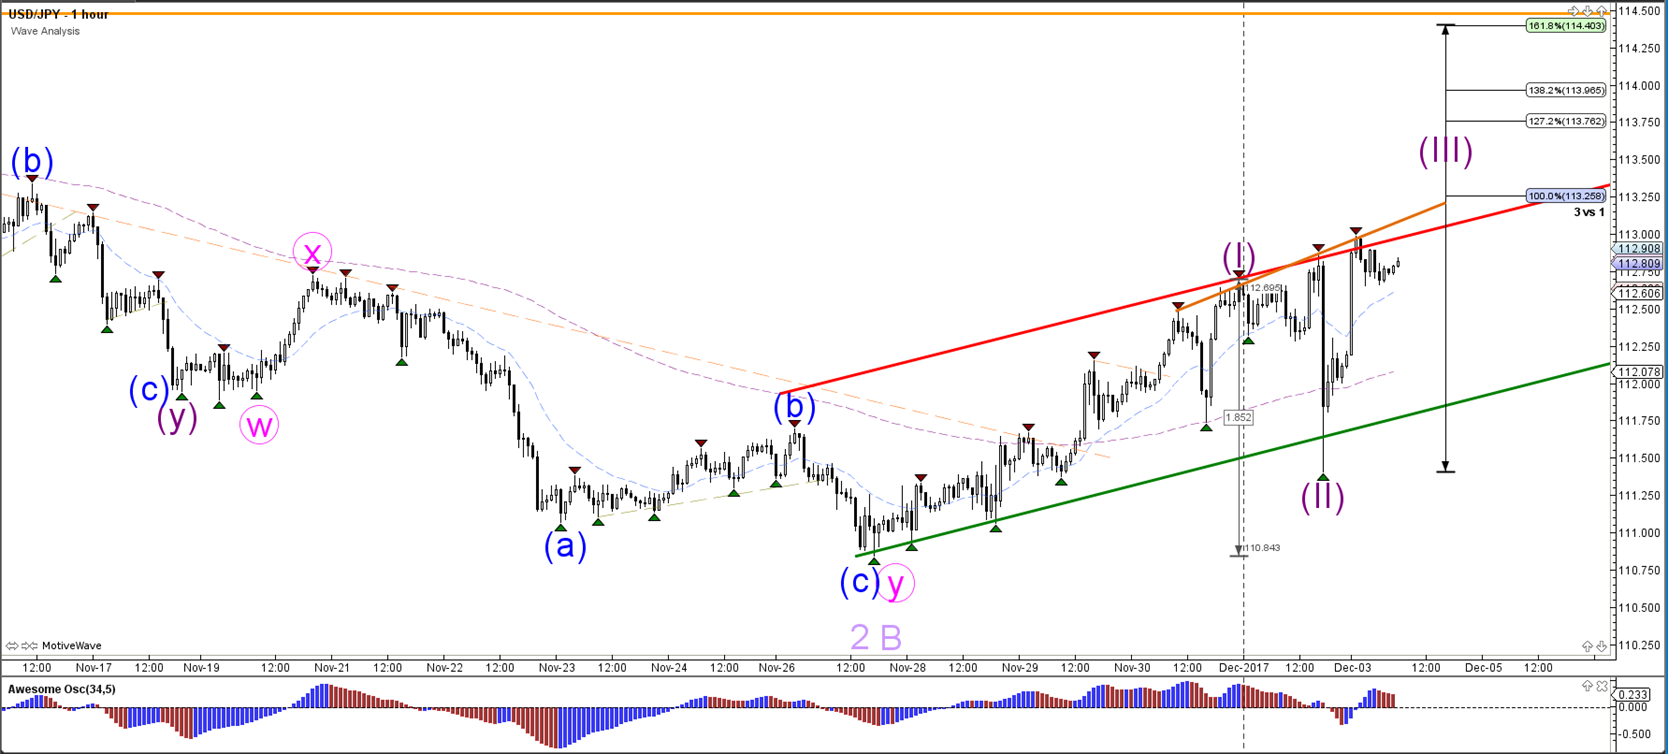
The USD/JPY will need to break above the resistance (red/orange) now or later to confirm the wave 3 pattern (purple).
GBP/USD
4 hour
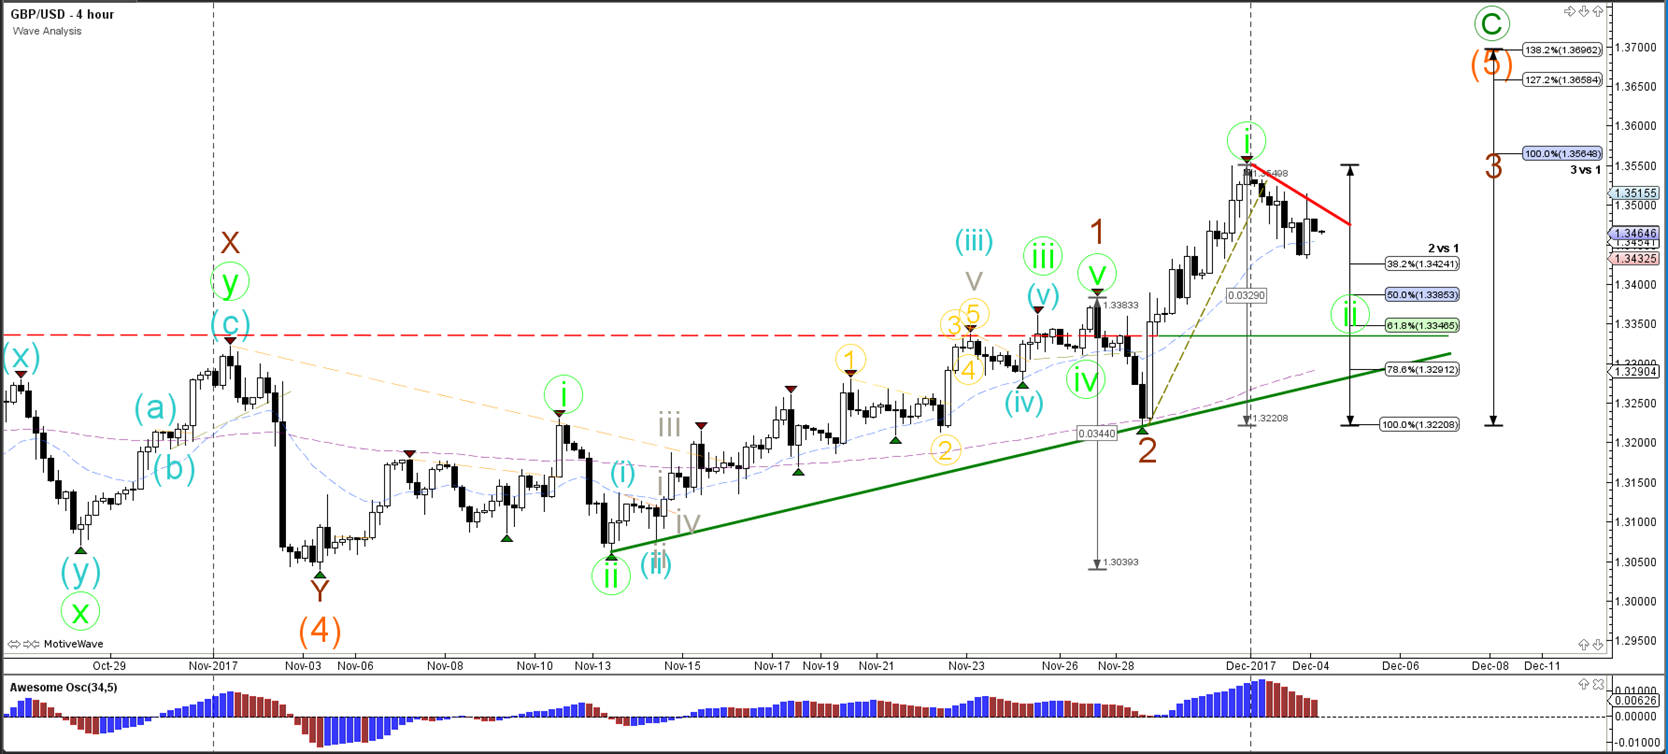
The GBP/USD could be in a wave 1-2 (green) unless price breaks below the 100% Fibonacci level of wave 2 vs 1. The broken resistance (dotted red) level is equal to the 61.8% Fibonacci support level.
1 hour
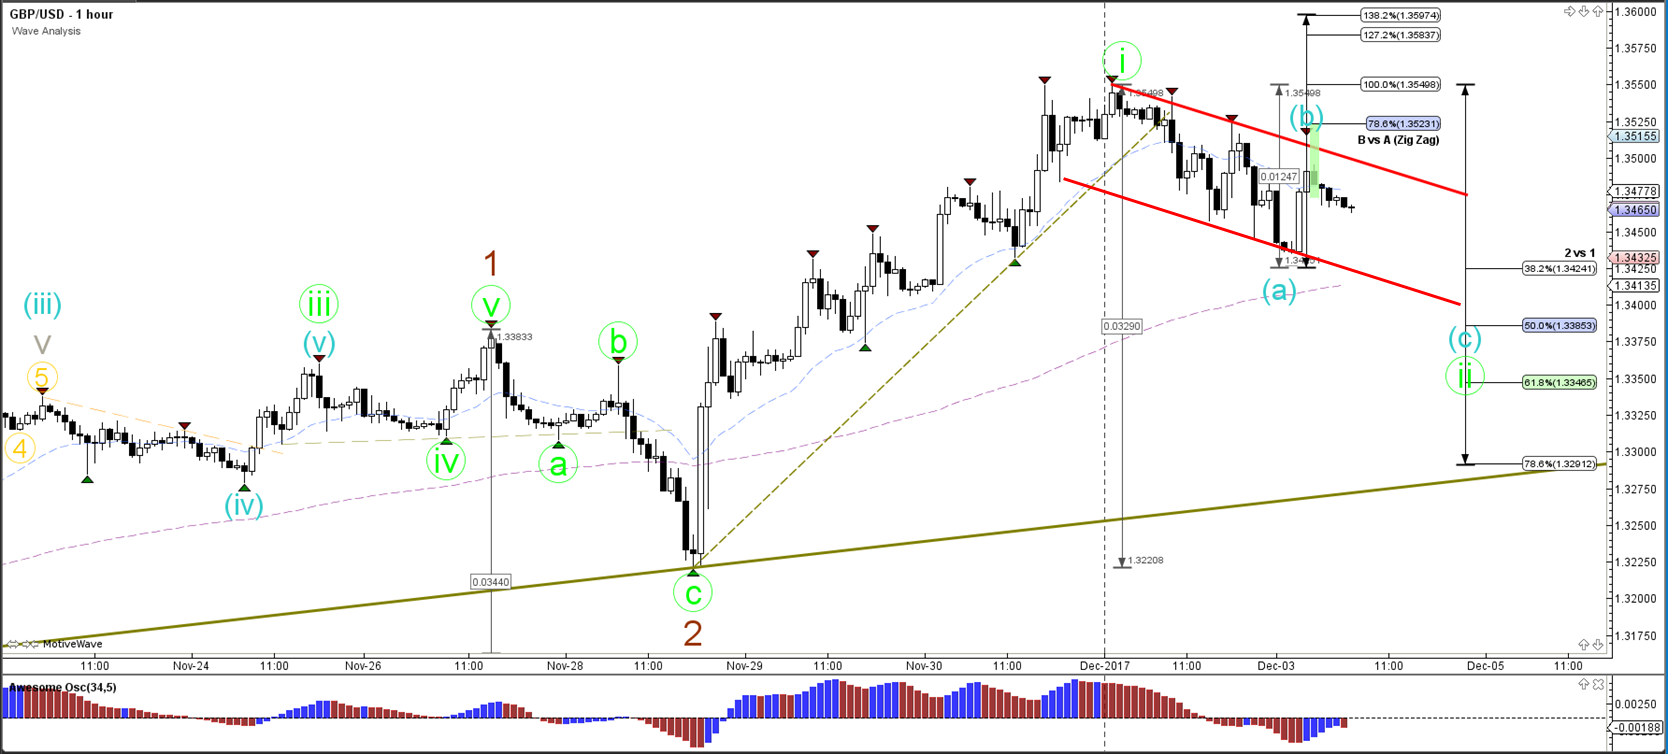
The GBP/USD is in a bearish trend channel and could be building a wave C (blue) within an ABC (blue).
Disclaimer: The opinions in this document are for informational and educational purposes only and should not be construed as a recommendation to buy or sell the stocks mentioned or to solicit ...
more

