EUR/USD Initiates Bearish Sequence, RSI Flashes Textbook Sell Signal

EUR/USD bounces back from a fresh weekly-low (1.2165) even as Federal Reserve officials strike an upbeat outlook for the U.S. economy, but the pair remains at risk of facing a larger pullback as it initiates a fresh series of lower highs & lows.
Fresh comments from Cleveland Fed President Loretta Mester suggest the Federal Open Market Committee (FOMC) will continue to normalize monetary policy over the coming months as the 2018 voting-member sees ‘salient upside risks’ to the economic outlook, and a growing number of central bank officials may prepare U.S. households and businesses for higher borrowing costs as Chair Janet Yellen and Co. forecast three rate-hikes for this year. With that said, the FOMC may utilize the January 31 interest rate decision to endorse a March rate-hike especially as ‘many participants judged that the proposed changes in business taxes if enacted, would likely provide a modest boost to capital spending.’
Nevertheless, the broader outlook for EUR/USD remains constructive as both the exchange rate and the Relative Strength Index (RSI) extend the upward trends from late last year, but the bullish momentum appears to be tapering off as the oscillator slips below 70 and flashes a textbook sell-signal.
EUR/USD Daily Chart
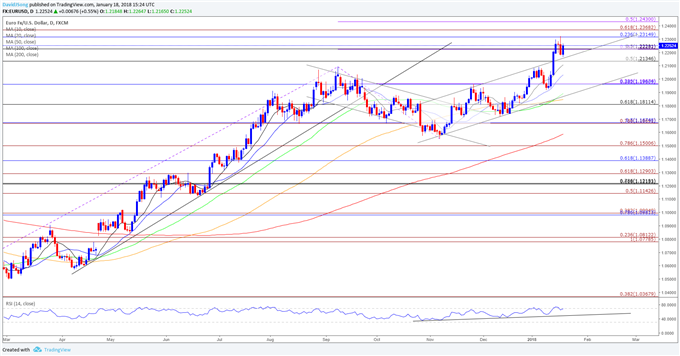
- EUR/USD may continue to carve a bearish sequence as the pair remains capped by the 1.2320 (23.6% retracement) to 1.2370 (61.8% expansion) region, with a break/close below 1.2130 (50% retracement) opening up the former-resistance zone around 1.1960 (38.2% retracement).
- At the same time, a near-term bull-flag formation may start to take shape as long as EUR/USD holds above the 1.2130 (50% retracement) region, with the next topside hurdle coming in around 1.2430 (50% expansion) followed by the 1.2500 (October 2014-low) handle.

The reaction to the Bank of Canada’s (BoC) first interest rate decision for 2018 limits the downside risk for USD/CAD as the central bank delivers a dovish rate-hike, with the topside targets coming back on the radar following the failed attempt to test the monthly-low (1.2355).
Unlike 2017, the BoC appears to be taming bets for a series of rate-hikes ‘as inflation is expected to remain close to 2 per cent over the projection horizon.’ It seems as though Governor Stephen Poloz and Co. will largely endorse a wait-and-see approach at the next meeting on March 7 as ‘uncertainty about the future of NAFTA is weighing increasingly on the outlook,’ and the central bank may continue to strike a less-hawkish tone over the coming months as ‘some continued monetary policy accommodation will likely be needed to keep the economy operating close to potential and inflation on target.’
As a result, USD/CAD may stage a larger recovery ahead of the FOMC meeting especially as the Relative Strength Index (RSI) pushes away from oversold territory.
USD/CAD Daily Chart
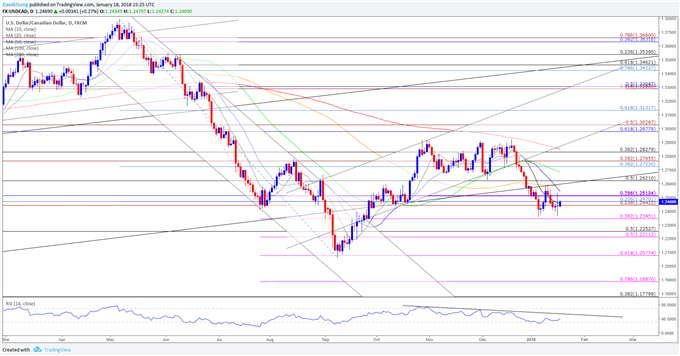
- USD/CAD appears to be on track to test the monthly-high (1.2590) as it snaps the bearish sequence from the previous week, while the 1.2350 (38.2% expansion) region offers support.
- A move back above the 1.2440 (23.6% expansion) to 1.2510 (78.6% retracement) region opens up the former-support zone around 1.2620 (50% retracement), with the next topside area of interest coming in around 1.2720 (38.2% retracement) to 1.2770 (38.2% expansion).
- Keep in mind, the Relative Strength Index (RSI) needs to break the bearish formation from late-October to boost the longer-term bullish outlook for the dollar-loonie exchange rate.