
EUR/USD Bearish Break To Challenge 61.8% And 78.6% Fib Levels
EUR/USD
4 hour
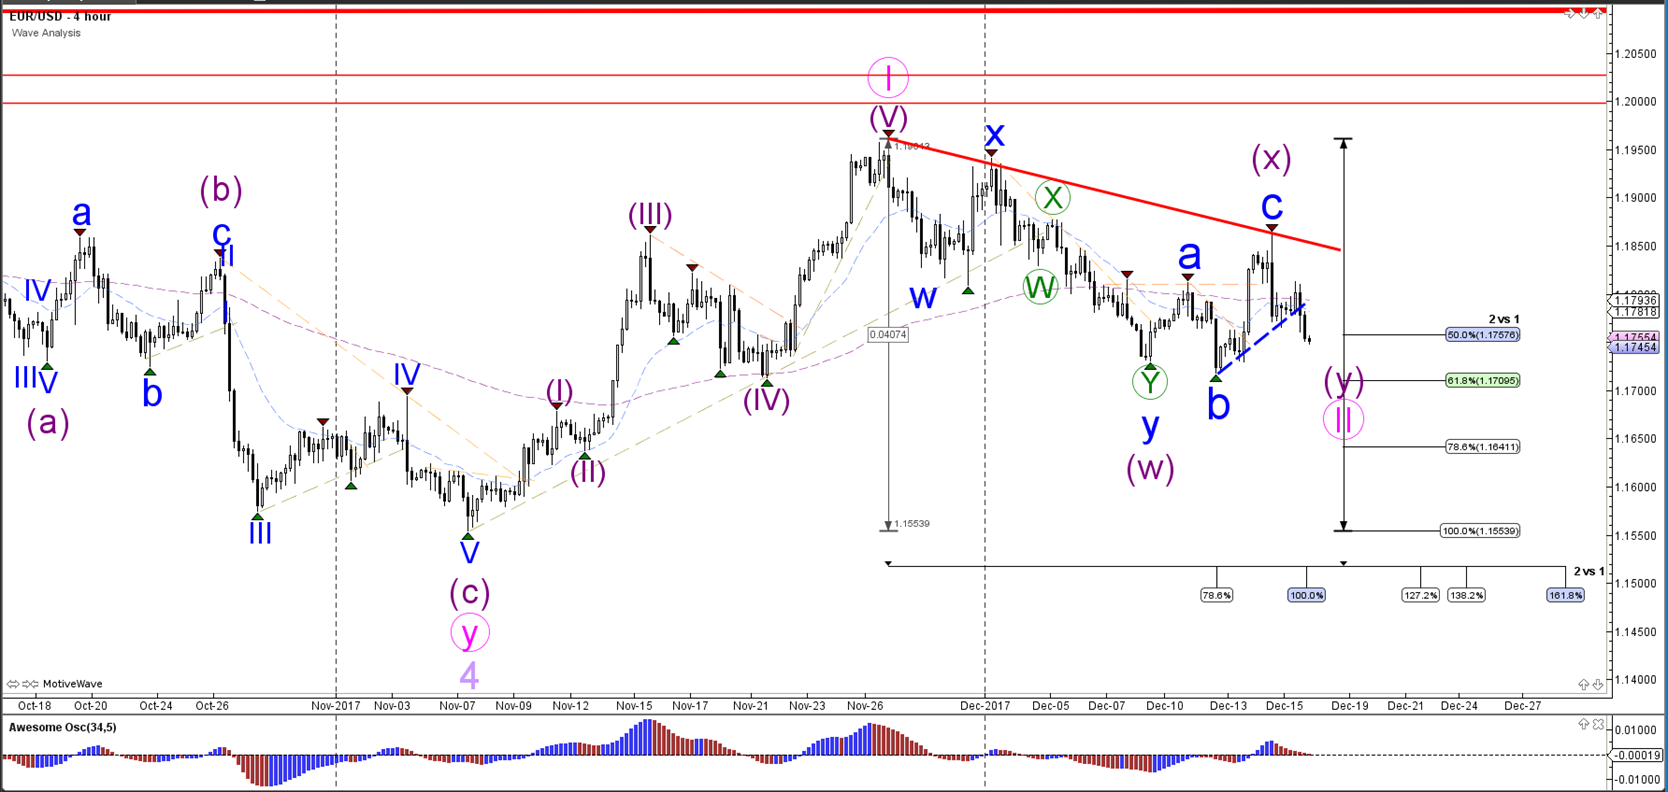
The EUR/USD bearish break below the support trend line (dotted blue) makes it likely that price will challenge the Fibonacci levels of wave 2 (pink). A break below the 100% Fib level of wave 2 vs 1 invalidates the wave 2 (pink) and indicates an expansion of wave 4 (light purple).
1 hour
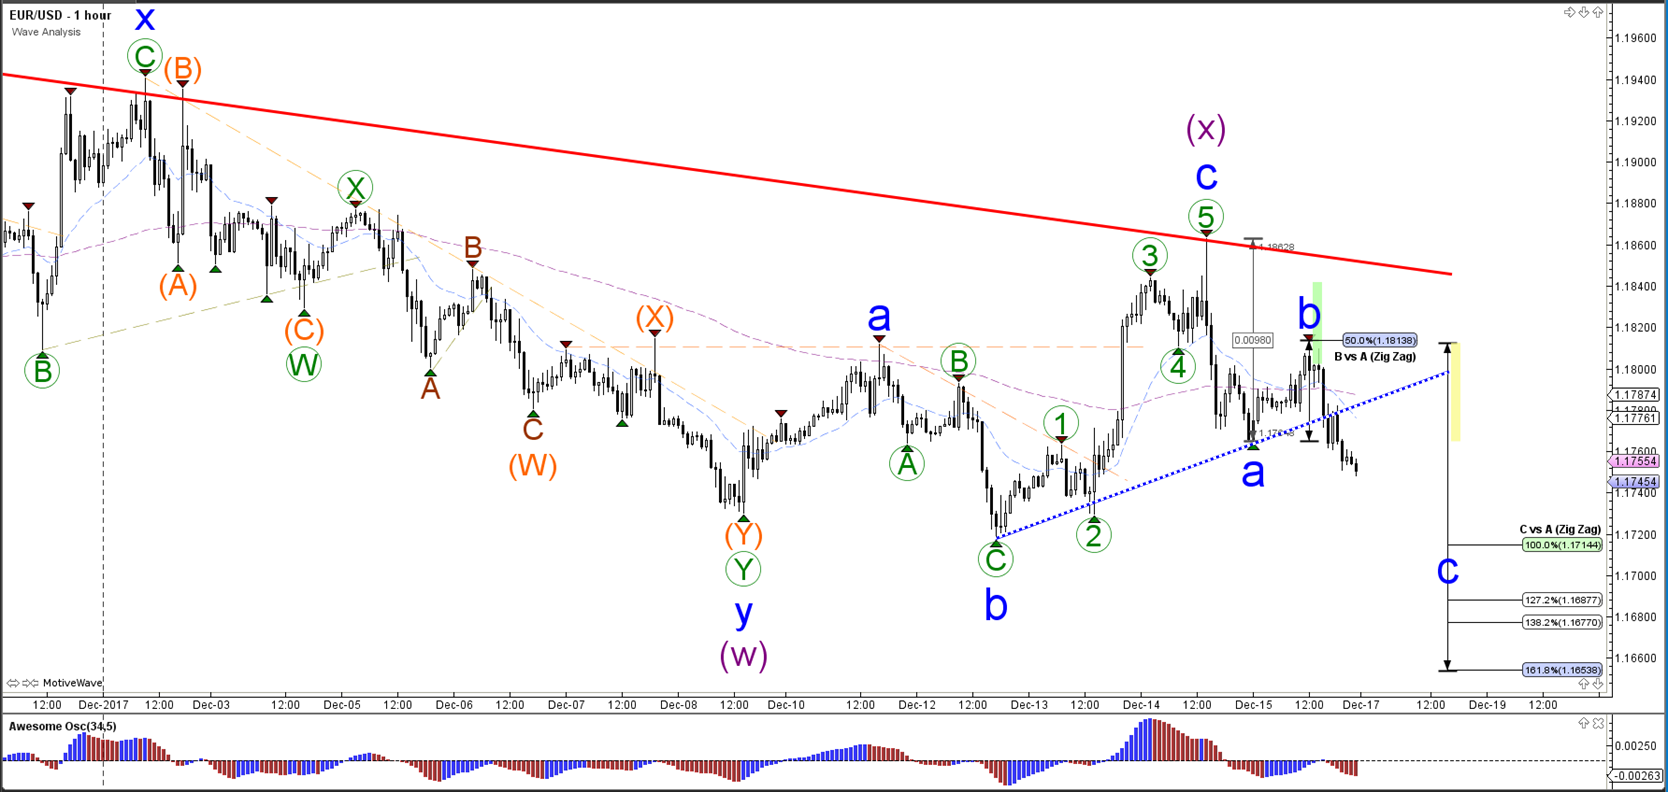
The EUR/USD indeed bounced at the support trend line but the rally turned at the Fibonacci levels of wave B (blue) as expected in last week's analysis. The bearish breakout could be part of wave C (blue).
GBP/USD
4 hour
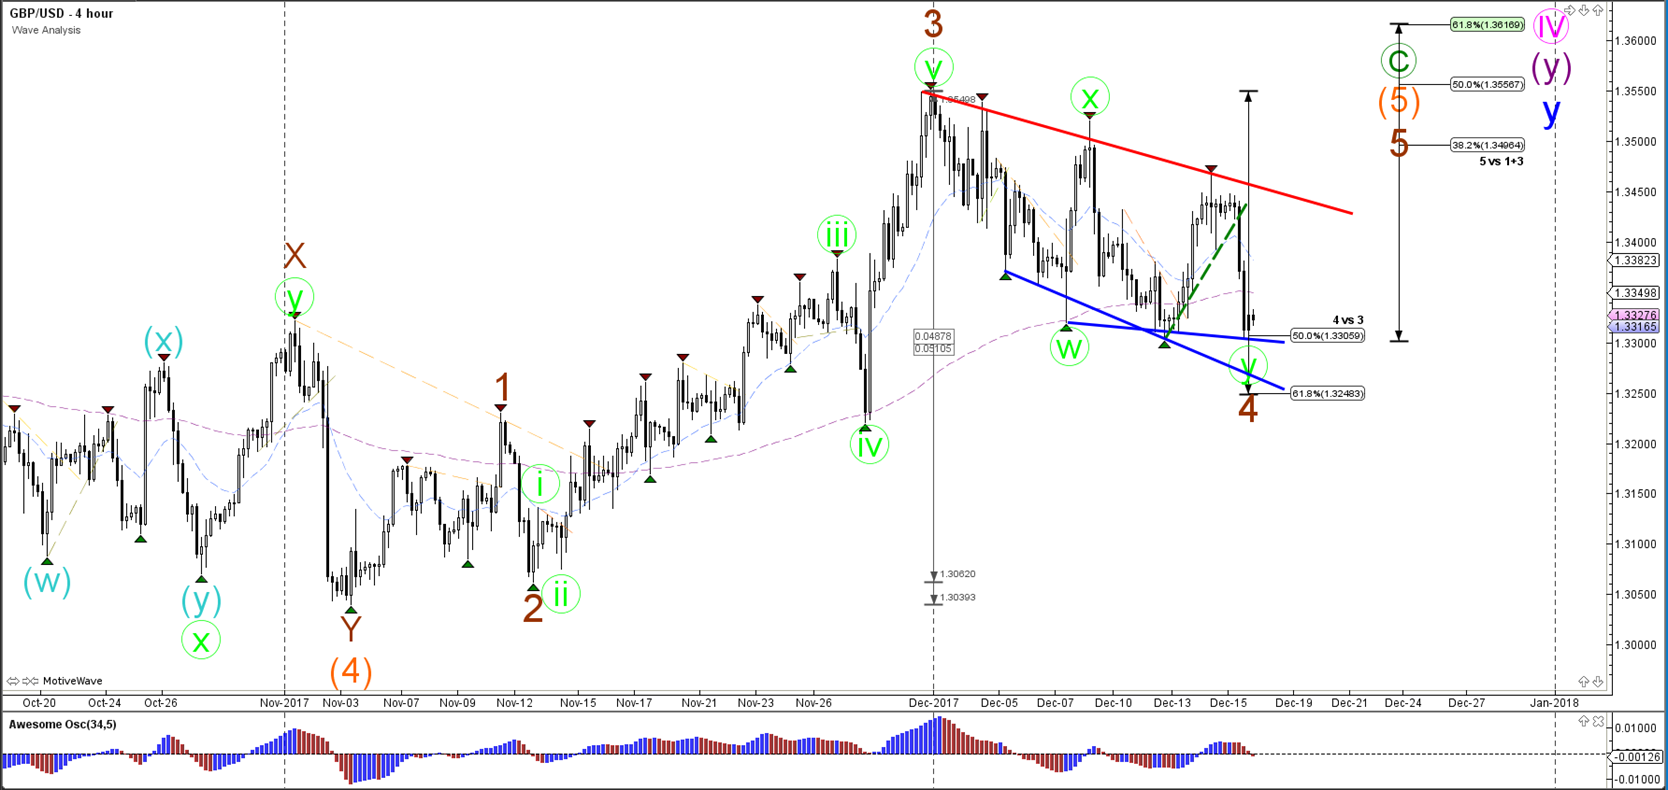
The GBP/USD is retesting the support zone (blue lines), which could lead to price making a bullish bounce again. There is also a 50% and 61.8% Fibonacci of wave 4 vs 3 (brown) that could provide support.
1 hour
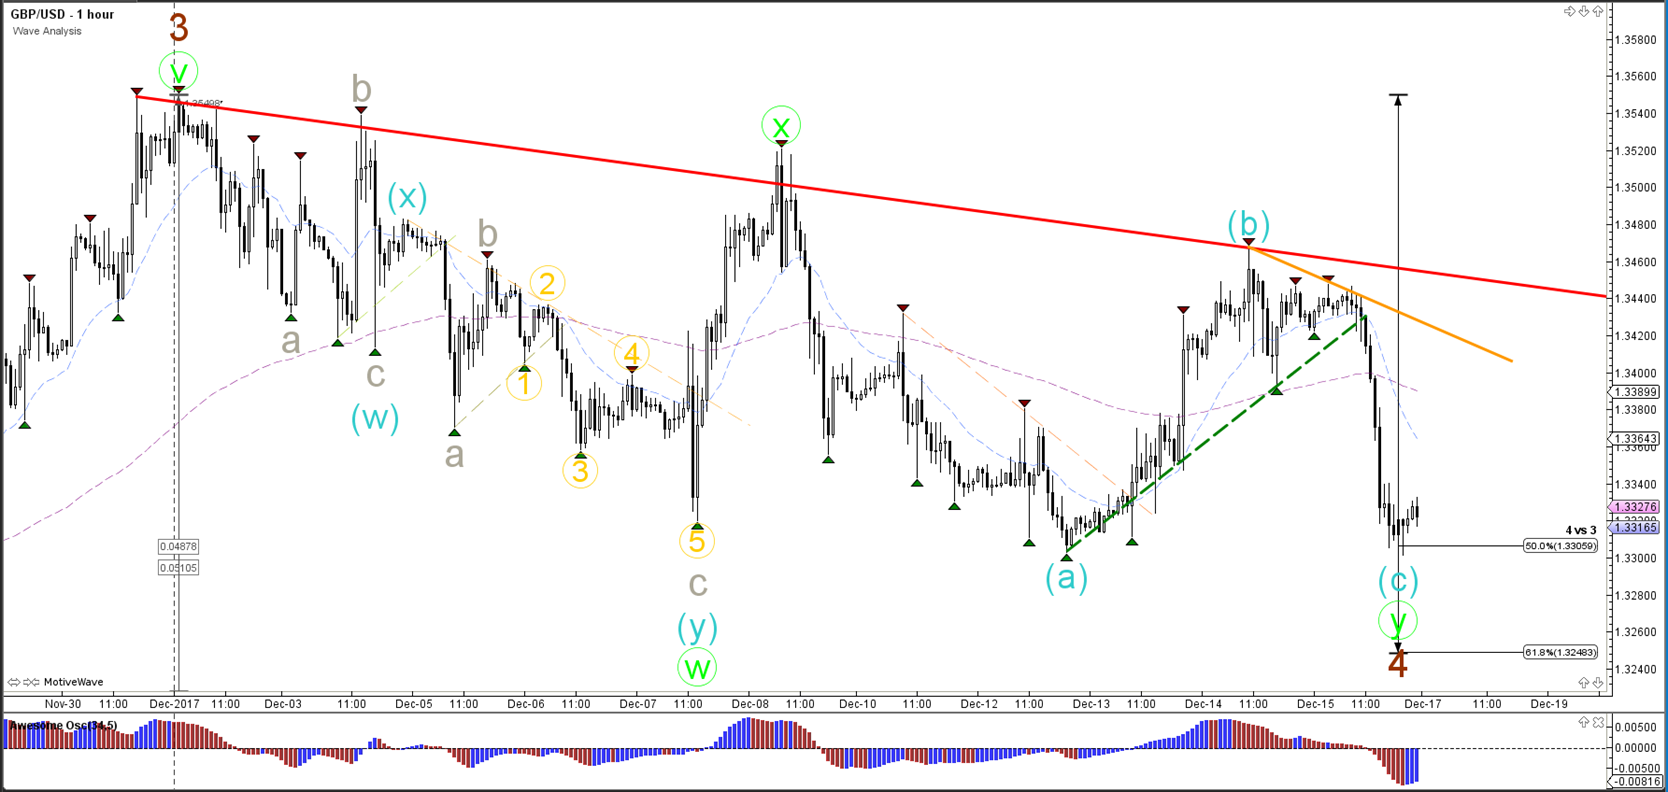
The GBP/USD broke below the support trend line (dotted green) and fell again to the Fibonacci levels of wave 4. A break below the 61.8% makes a wave 4 less likely.
USD/JPY
4 hour
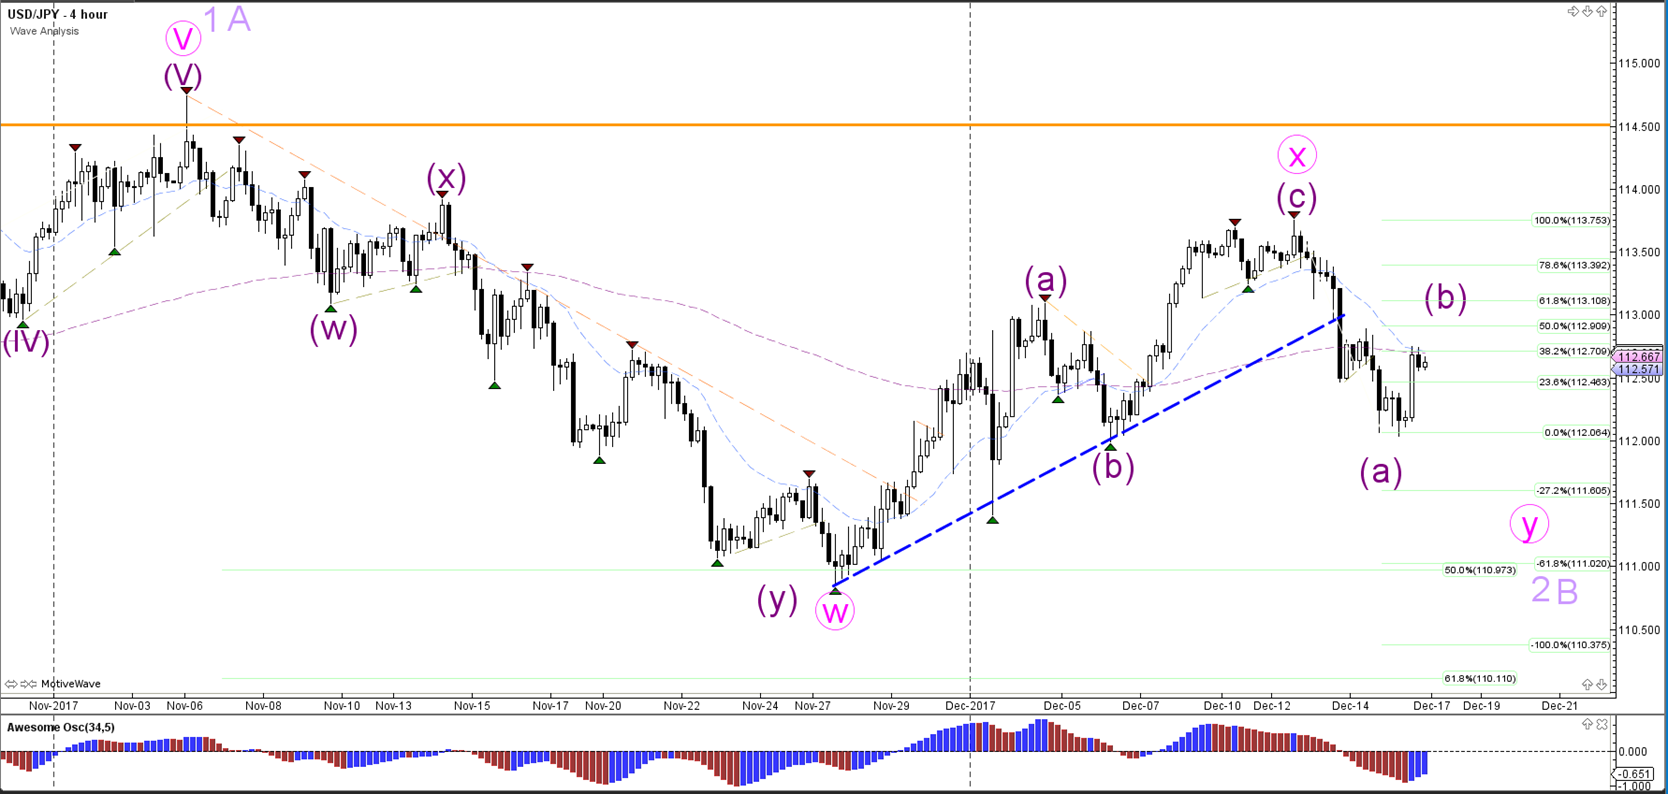
The USD/JPY indeed made a bullish bounce after reaching 112. The price action could be part of a wave B (purple) as price extends its bearish correction towards 111 and 110. A break above the 100% Fib level at 113.75 invalidates the ABC zigzag.
1 hour
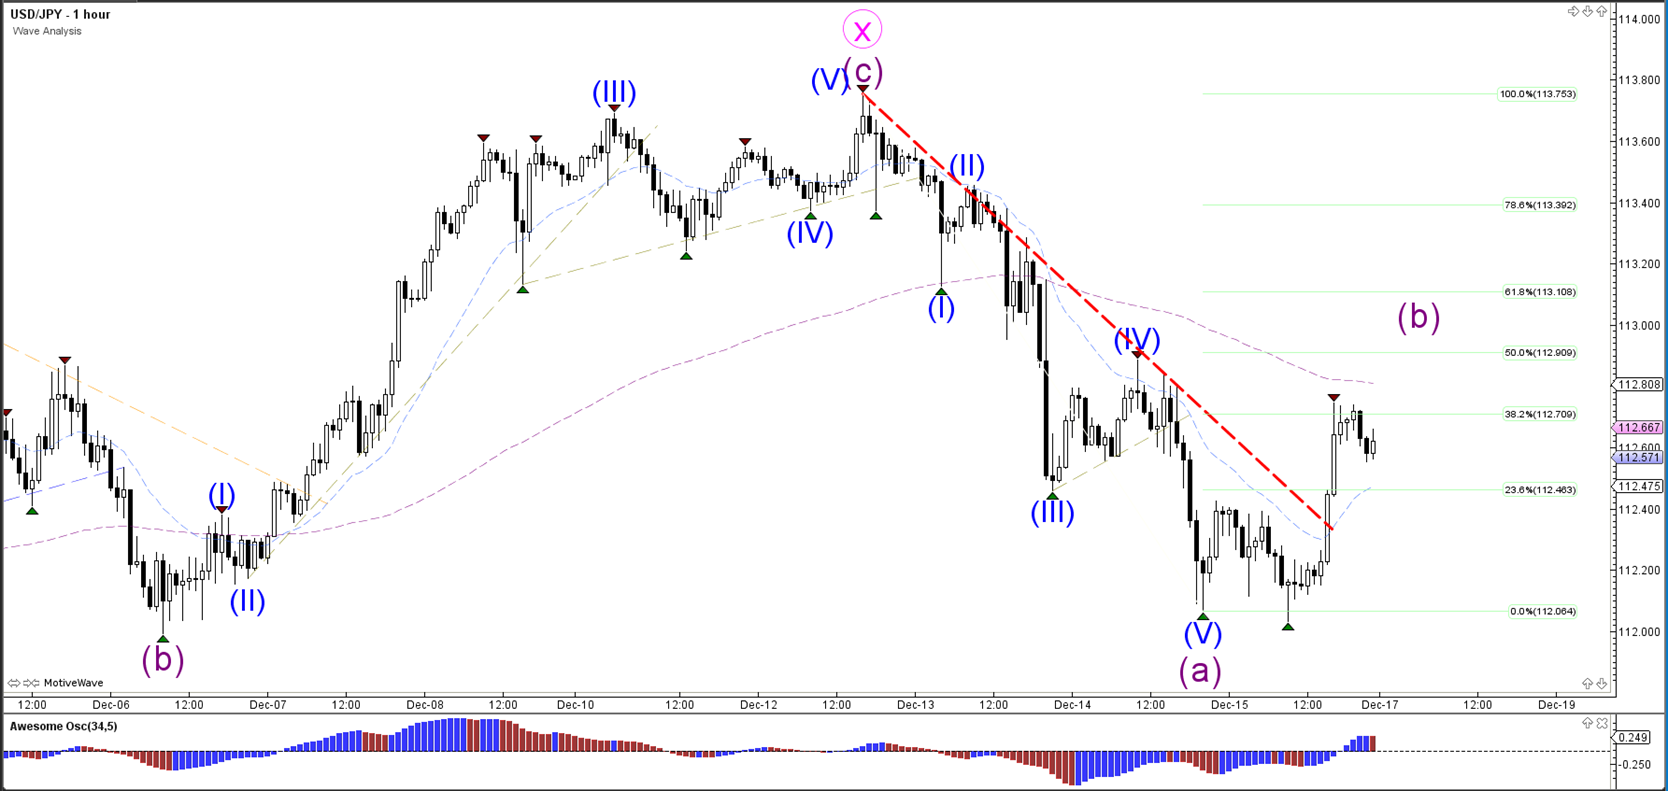
The USD/JPY is respecting the 38.2% Fib but could extend the correction to higher Fibs before making a bearish bounce.
Disclaimer: The opinions in this document are for informational and educational purposes only and should not be construed as a recommendation to buy or sell the stocks mentioned or to solicit ...
more

