
DXY Elliott Wave View: More Downside
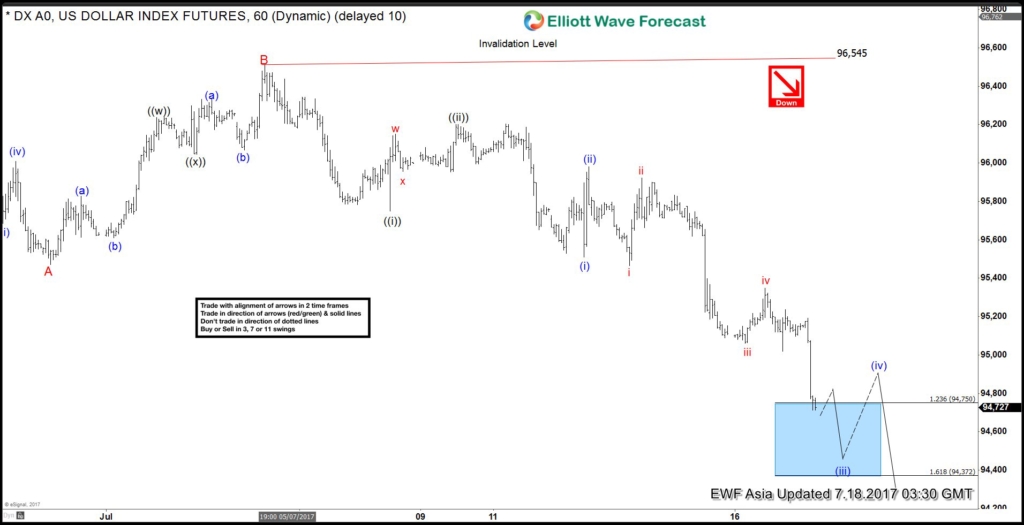
Short term DXY (USD Index) Elliott Wave view suggests the decline from the 6/20 peak (97.87) is unfolding as a Zigzag Elliott Wave structure. Down from 97.87 high, a decline to 95.47 ended Minor wave A, and a bounce to 96.51 high ended Minor wave B.
Wave C is unfolding as an Elliott wave Impulse structure with extension where Minute wave ((i)) ended at 95.75 and Minute wave ((ii)) ended at 96.2. Minute wave ((iii)) is subdivided into another impulsive wave of a smaller degree. Minute wave (i) ended at 95.51, Minute wave (ii) ended at 95.98 and Minute wave (iii) is currently in progress. Expect Minute wave (iii) to end at the 94.3 – 94.7 area, then the Index should bounce in Minute wave (iv) before turning lower again. We don’t like buying the Index and expect bounces to find offer in 3, 7, or 11 swing for more downside.
DXY 1 Hour Elliott Wave Chart
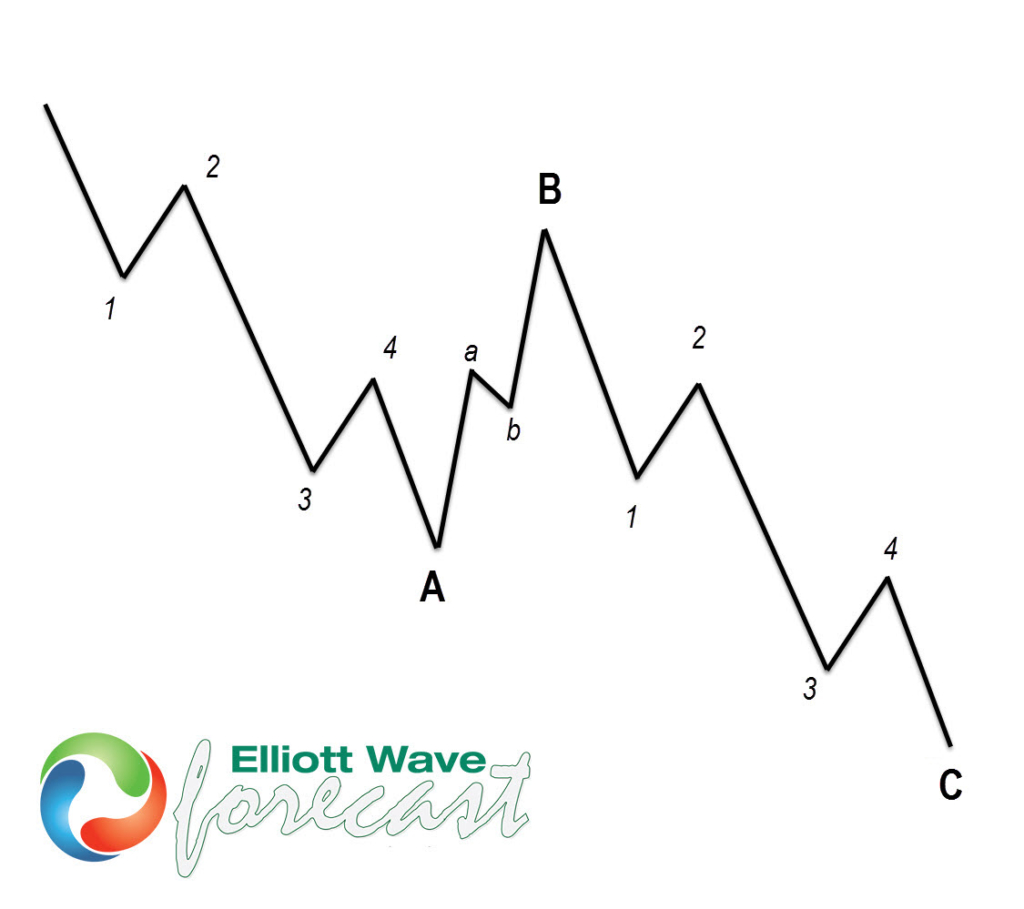
A-B-C Structure
According to Elliott wave theory, Zigzag is a 3 wave structure having internal subdivision of (5-3-5) swing sequence. The internal oscillations are labeled as A, B, C where A = 5 waves, B = 3 waves and C = 5 waves. This means that A and C can be impulsive or diagonal waves (Leading Diagonal in the case of wave A or Ending Diagonal in the case of wave C). The A and C waves must meet all the conditions of 5 waves structure, such as: having an RSI divergence at the fifth wave, ideal Fibonacci extensions, ideal retracements etc.
As the graphic below shows, we can see what Elliott Wave Zig Zag structure looks like. 5 waves down in A, 3 wave bounce in B and another 5 waves down in C.
Disclosure: None.


