
Above The 40 – The Bears Engulf An Otherwise Uplifting Week For The Stock Market
The S&P 500 (SPY) gained 2.0% for the week. Yet the week felt like a loser given the way it ended. The S&P 500 dropped marginally on Friday, just 0.3%, but the close represented a fade from a gain and a near test of downtrending resistance at the 50-day moving average (DMA).
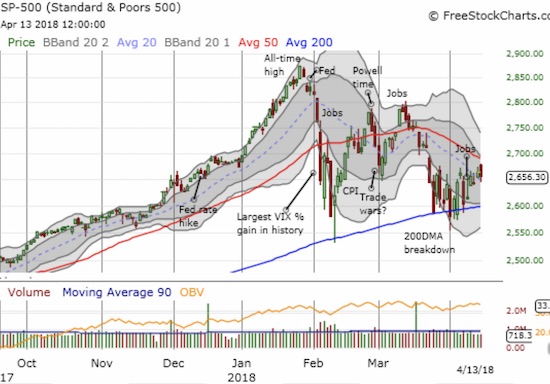
The S&P 500 (SPY) melted in the face of 50DMA resistance as a Bollinger Band (BB) squeeze starts to form.
That sinking feeling really came from the financials. Several big banks reported earnings. JP Morgan (JPM) and Citigroup (C) came out the gate strong with gaps up. While Citigroup rammed right into resistance at its downtrending 50DMA, JPM seemed to confirm the previous day’s 50DMA breakout. Sellers took over from there for the rest of the day. Wells Fargo (WFC) gapped DOWN at the open and ended the day with a 3.4% loss and a new 7-month low. The end result for the Financial Select Sector SPDR ETF (XLF) was a bearish engulfing pattern that started with a gap up to unyielding declining 50DMA resistance. I cannot see anything better than more churn ahead with the financials failing this important test of earnings season. My XLF calls went from near even to slashed in half. I only held on to see whether the financial earnings in the coming week can help salvage things.
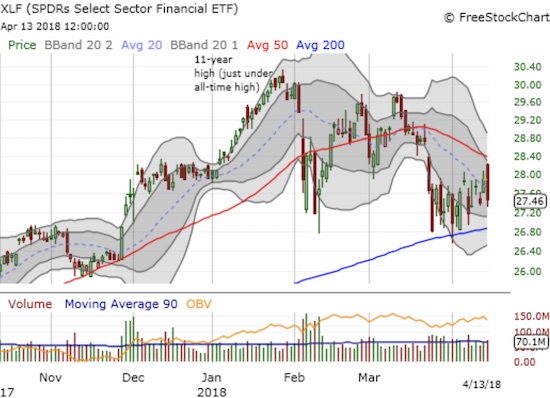
The Financial Select Sector SPDR ETF (XLF) is stuck between slowly converging resistance from its 50DMA and support from its 200DMA. The bearish engulfing print warns of a negative outcome of the convergence.
The main positive from XLF is that, so far, it is surviving the critical test presented from the March 23 plunge toward 200DMA support that practically stopped on a dime.
Tech stocks also suffered a bearish engulfing end to the week that confirmed powerful resistance at declining 50DMAs. Unlike XLF, the NASDAQ and the PowerShares QQQ ETF (QQQ) are still trading above the big up day on April 4 that seemed to confirm 200DMA support. In fact, an uptrend from those lows remains in place and a distinct V-pattern can provide some hope to bulls that a breakthrough can still happen in the near future.
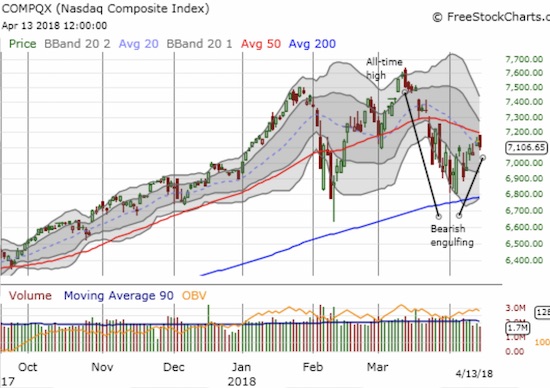
The Nasdaq still has upward momentum from its test of 200DMA support despite the setback at 50DMA resistance.
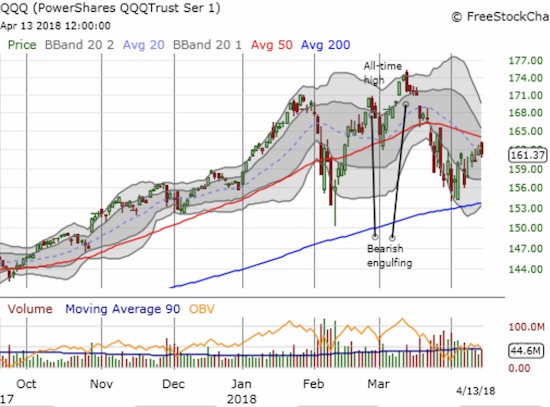
The PowerShares QQQ ETF (QQQ) is in the same boat with the NASDAQ.
Small-caps are in the best position. A bearish engulfing pattern did not tank the iShares Russell 2000 ETF (IWM) back below its 50DMA.
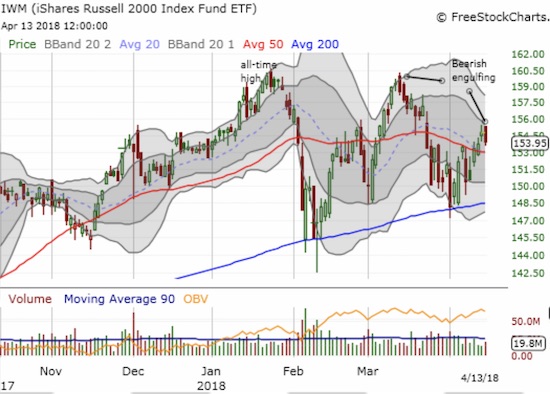
The iShares Russell 2000 ETF (IWM) made a bullish breakout this week. A bearish engulfing conclusion to the week may have brought that bullish move to an end for now.
The big surprise of the day was the volatility index, the VIX. Even with the fade underway across the stock market and despite going into a weekend full of geo-political uncertainty over Syria and the political uncertainty around the latest round of “Trump versus Comey,” the VIX could not hold traction. The VIX lost 5.9%, closed at its low of the day, and finally confirmed the reversal of the surge on March 22nd. When the VIX bounced early in the day, I decided to take profits on my short in iPath S&P 500 VIX ST Futures ETN (VXX). I assumed that I would be able to short again at a higher price later in the day or on Monday. Now I am not so sure. (I still see VXX eventually returning to its all-time low and beyond, so I see great risk/reward here). Still wary, I decided to load up on call options on ProShares Ultra VIX Short-Term Futures (UVXY) at the end of the day.
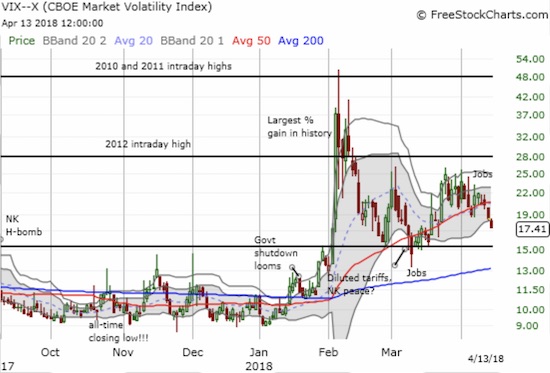
The volatility index, the VIX, went into the weekend limping and burdened by the growing pressure of a downward bias.
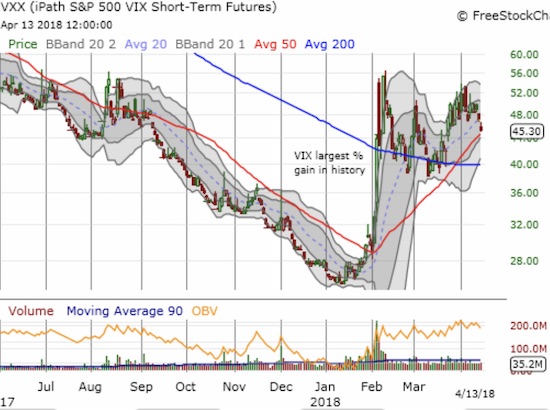
The iPath S&P 500 VIX ST Futures ETN (VXX) may have finally topped out but still has a ways to go to reverse the big surge from the VIX’s largest percentage gain ever.
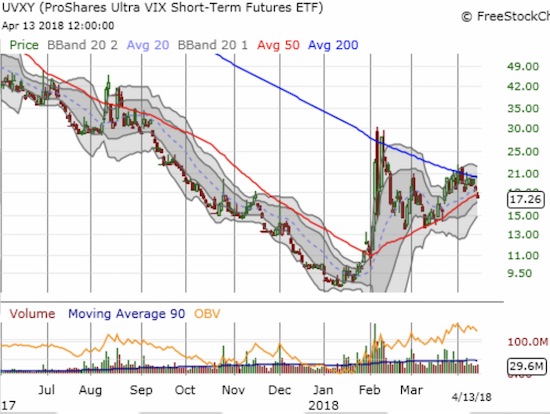
The ProShares Ultra VIX Short-Term Futures (UVXY) has failed multiple times at its declining 200DMA resistance. It closed below its now sharply increasing 50DMA for the first time in over 2 months.
And then there is the currency market. Remarkably, the currency market seems relatively unconcerned with the chop in the stock market. The Australian dollar (FXA) versus the Japanese yen (FXY) has powered higher since its March low. AUD/JPY surged the last two days and even broke out above declining 50DMA resistance. Like the stock market, AUD/JPY ended the week with a big fade. I was tempted, but I avoided reshorting the currency pair. I see no point in using it as a hedge at this juncture. Instead, I will wait to short into weakness, like a fresh (confirmed) breakdown below its 50DMA.
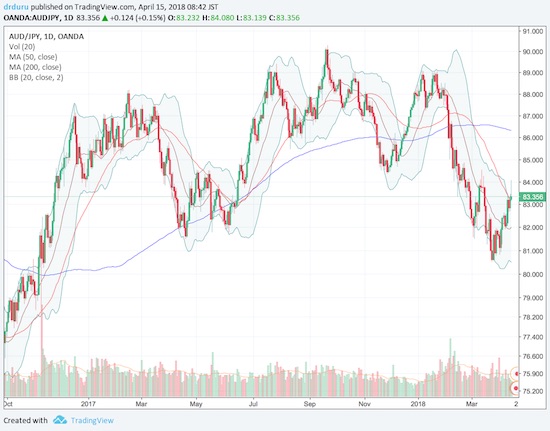
Source: TradingView.com
AUD/JPY survived a test of its 2017 lows, but has the rally come to a screeching halt with the bearish fade to end the week?
Finally, there is AT40 (T2108), the percentage of stocks trading above their respective 40DMAs. AT40 closed the week at 45.9%. At its high, AT40 matched the high from March, its highest point since the big bounce from February’s oversold conditions. So even with the bears making a strong statement to end the week, the market in general is still on the edge of a major, bullish breakthrough. One week after fighting off the barbarians posturing at critical 200DMA support, the S&P 500 needs just one more spark to get its big breakthrough. If earnings season fails to provide this spark, look out for May.
CHART REVIEWS
Boeing
In a choppy week, it was a relief to find a consistent trade in Boeing (BA). True to form, BA bounced up and down like a yo-yo in a tight formation. Given I am using it as a hedge against bullishness, I faded each bounce and closed out the position on the next drawdown. I closed out my latest put a little early on Friday.
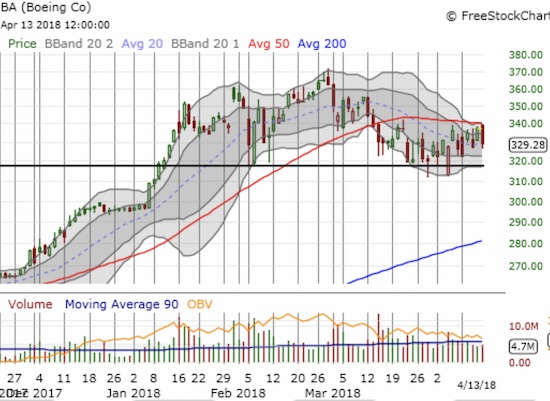
Boeing (BA) completed a third week of chop tightly capped by its 50DMA and supported by the February intraday lows.
Bed Bath & Beyond Inc.
After I started tempering my expectations for the 2018 trade in retail stocks, I continued to hang on to Bed Bath & Beyond (BBBY). The stock looked relatively resilient as it stuck to a trading range that, despite the slight downward bias, looked like it could be providing consolidation. A 20.0% plunge in reaction to the latest earnings report starkly reminded me that there will be no tide that lifts all boats for retail this year. I will be exiting this stock in the coming week. Note that BBBY last traded this low in the throes of the financial crisis.
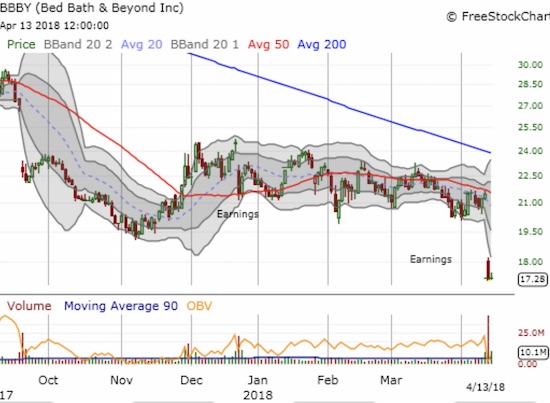
A fresh post-earnings collapse for Bed Bath & Beyond Inc. (BBBY) and a fresh 9+ year low.
Caterpillar
Caterpillar (CAT) met stiff resistance at its downtrending 50DMA. I added two more put options to my hedge against bullishness. The next CAT sell-off (if one comes) should create a direct test of support at the uptrending 200DMA.
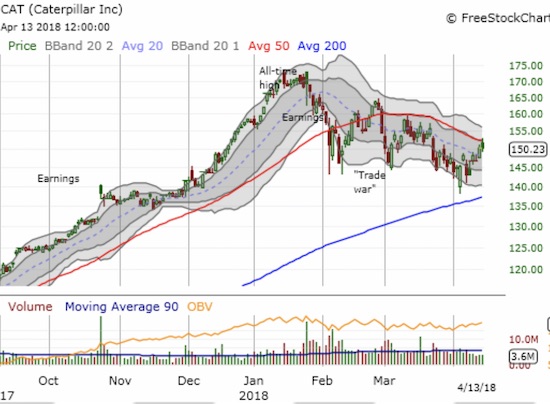
A 50DMA rejection keeps a downtrend from the all-time intact for Caterpillar (CAT)
Lennar
Lennar (LEN) looked great for all of two days after a tremendous post-earnings response. The sellers took over from there for every single day except to end trading this week. This was a stunning 100% reversal of a big post-earnings gain. For a minute, it looked like the homebuilders were ready to rally again with LEN’s big breakout. After accumulating a fresh position of call options in LEN, I reinstituted pause on housing plays.
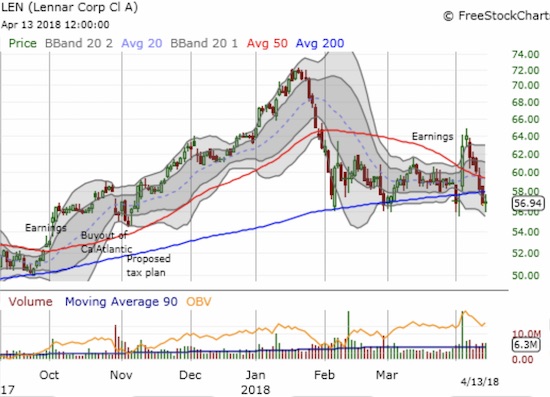
Lennar (LEN) is back where it started before its last earnings report. The stock is back to the lows of 2018 for a third time. Can support hold yet again?
KB Home
I had to put another pause on housing-related plays because LEN’s reversal reminded me of the catastrophic reversal that KBH experienced after January earnings. That selling was like the early topping signal for the sector and even the stock market. Sellers faded the last earnings report even faster than January’s. I bought more call options on KBH in the wake of LEN’s good earnings. I was encouraged by the 50DMA breakout the next day. Sellers essentially took over again from there and poof went my quick profits. I am trying to stay optimistic that the return to consolidation is firming up support at the 200DMA.
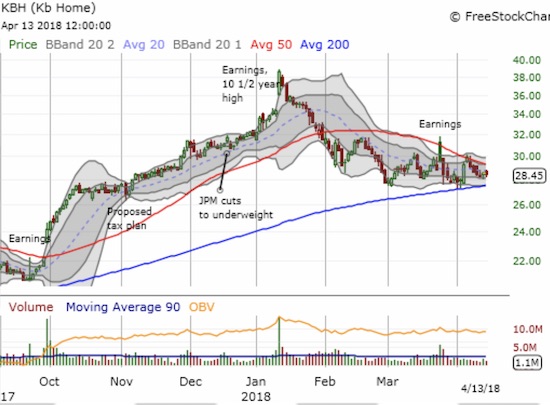
KB Home (KBH) is getting squeezed between a downtrending 50DMA and uptrending 200DMA.
Autozone and O’Reilly
Back on December 13th, I suggested Jim Cramer was a little late pointing out the bottoming in the stocks of auto parts retailers. The stocks had one more burst in January (a month that made all of us with almost any bullish opinion look like geniuses), but now they trade below those mid-December levels. O'Reilly ORLY is down 6.5% year-to-date and is struggling to hold on to critical 200DMA support. Autozone AZO is faring a lot worse: the stock is down 14.7% year-to-date and sliced right through 200DMA support to start the month of April. Now that I have the pullbacks I wanted to start a fresh position, I find myself wary of what looks like freshly persistent weakness: sharply declining 50DMAs and failing 200DMA supports. I will stay content to wait for the next round of earnings before making any trades here.
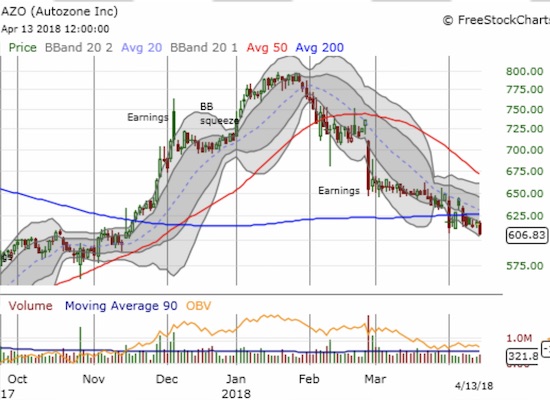
Autozone (AZO) seriously has technical issues. The last earnings generated a sharp breakdown from a head and shoulders top. Now the stock is breaking down below 200DMA support with rapidly declining 20 and 50DMAs.
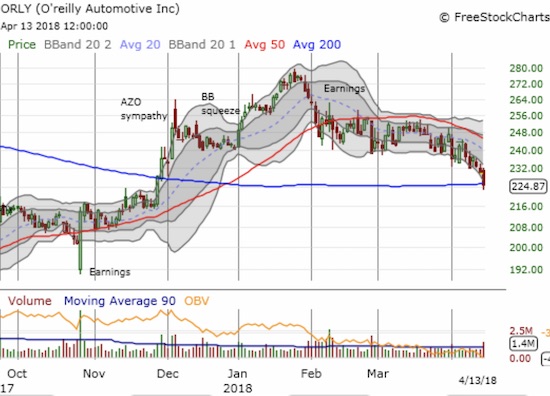
O’Reilly Automotive, Inc. (ORLY) experienced an increase in volume as it tested 200DMA support. Can the stock regain momentum?
Energy Select Sector SPDR ETF
Energy stocks look like they are waking up from their collective slumber. XLE made a convincing breakout on Tuesday with a gap above its 50 and 200DMAs and a close above the recent consolidation range. I loaded up on call options on Thursday in anticipation of a run-up similar to the last 50/200DMA breakout.
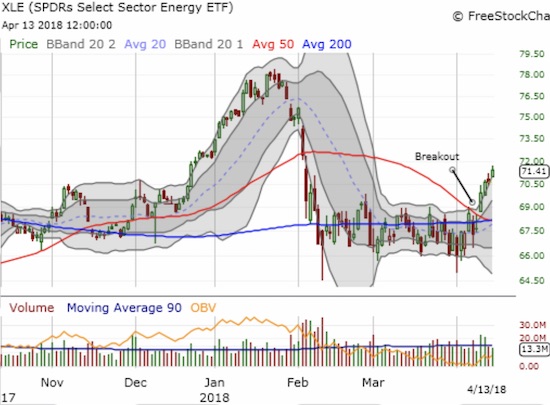
The Energy Select Sector SPDR ETF (XLE) broke out convincingly last week.
“Above the 40” uses the percentage of stocks trading above their respective 40-day moving averages (DMAs) to assess the technical health of the stock market and to identify extremes in market sentiment that are likely to reverse. Abbreviated as AT40, Above the 40 is an alternative label for “T2108” which was created by Worden. Learn more about T2108 on my T2108 Resource Page. AT200, or T2107, measures the percentage of stocks trading above their respective 200DMAs.
Active AT40 (T2108) periods: Day #40 over 20%, Day #9 over 30%, Day #4 over 40% (overperiod), Day #23 under 50%, Day #48 under 60%, Day #54 under 70%
Daily AT40 (T2108)

Black line: AT40 (T2108) (% measured on the right)
Red line: Overbought threshold (70%); Blue line: Oversold threshold (20%)
Weekly AT40 (T2108)

All charts created using freestockcharts.com unless otherwise stated.
The charts above are my LATEST updates independent of the date of this given AT40 post. For my latest AT40 post click here.
AT40 = 45.9% of stocks are trading above their respective 40-day moving averages (DMAs)
AT200 = 44.0% of stocks are trading above their respective 200DMAs
VIX = 17.4
Short-term Trading Call: neutral
Related links:
The AT40 (T2108) Resource Page
You can follow real-time T2108 commentary on twitter using the #T2108 or #AT40 hashtags. T2108-related trades and other trades are occasionally posted on twitter using the #120trade hashtag.
Disclosure:long SPY shares, long CAT puts, long UVXY, long LEN and KBH calls, long XLE calls, long XLF calls, long BBBY
Follow Dr. Duru’s commentary on financial markets via more


