
Where Gold Goes… Silver Follows
(Click on image to enlarge)
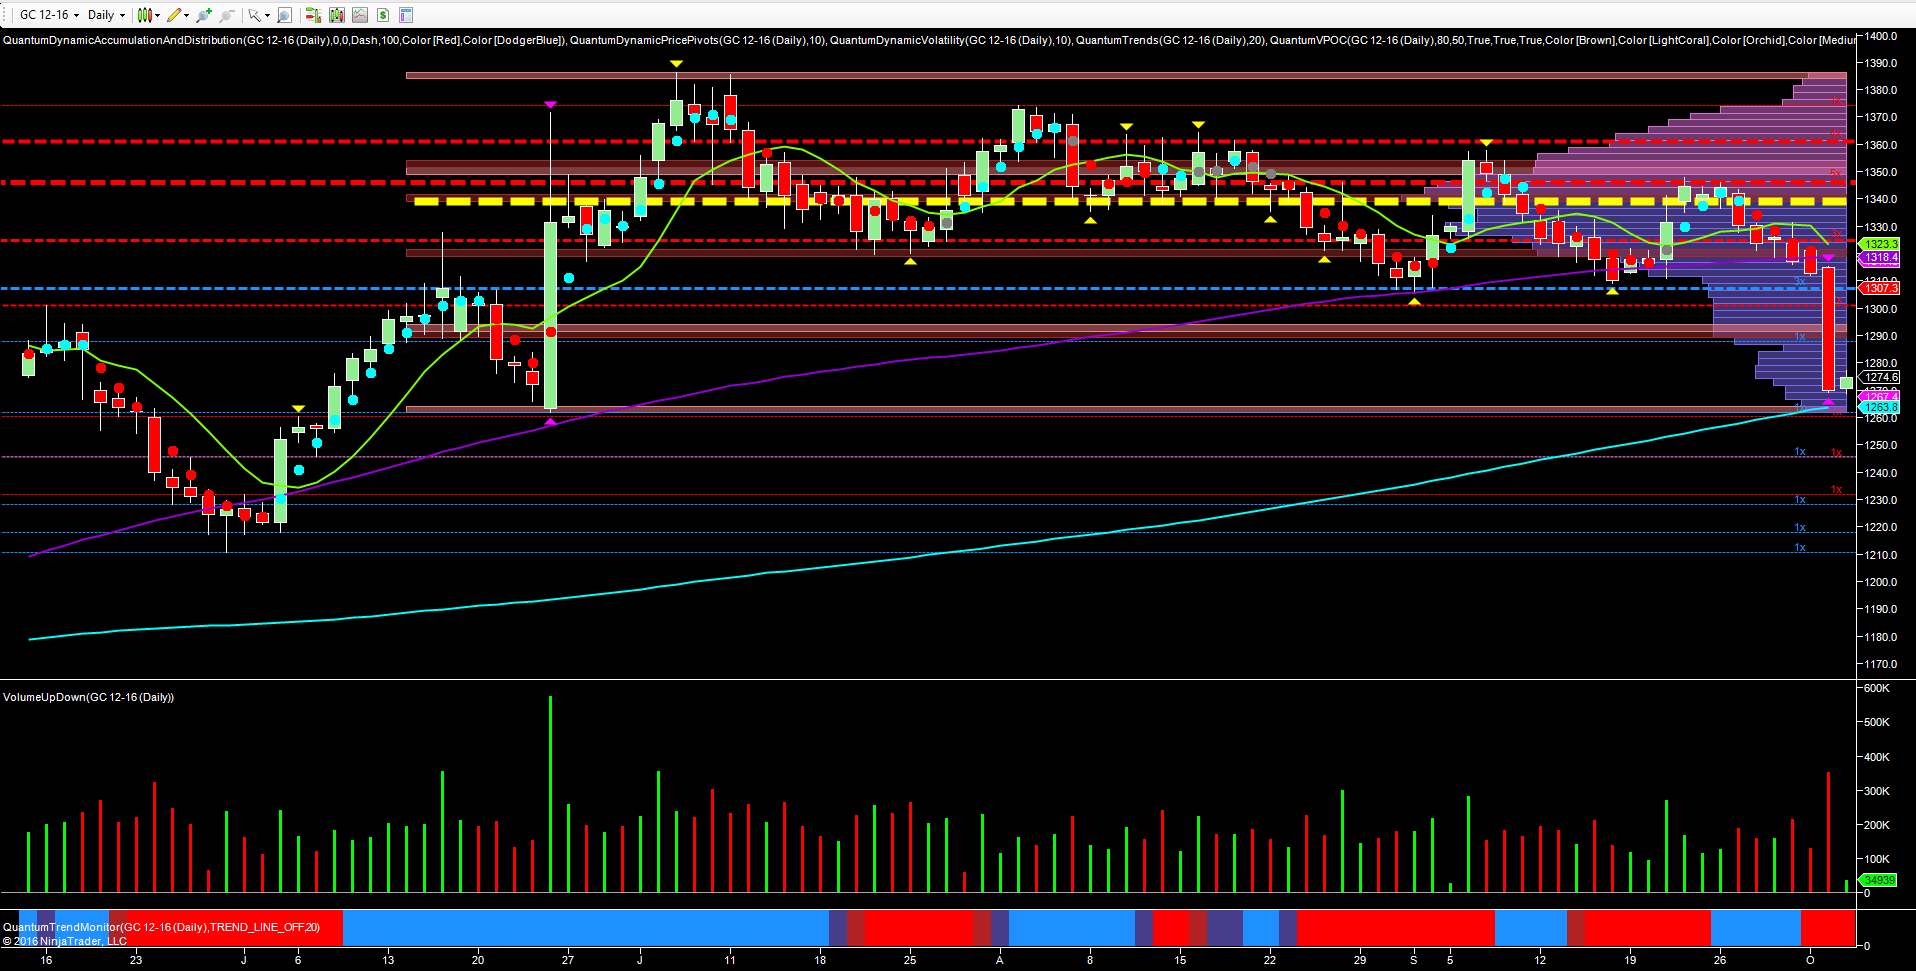
The savage reaction in gold yesterday surprised even me, and following my gold post of yesterday morning, I thought it would be apposite to follow up with another for gold and silver, as the technical picture for the industrial metal was almost identical. My quote from yesterday was as follows :
‘However, following yesterday’s move lower and a continuation of the bearish sentiment in early trading today, this level is once again under attack, and as I have said in previous analysis, if this floor is breached then gold looks set to test the Brexit low of $1260 per ounce, with only minor potential support waiting in the $1290 per ounce area‘.
I have to confess I was not expecting this price action to occur in the space of one day, but this is precisely what happened, with collapse to the downside, taking out potential support at the $1290 per ounce area, and denoted with the blue dotted line coupled with the high volume node, before closing at $1269.70 per ounce and falling just short of the low of the Brexit candle. Yesterday’s wide spread down candle was also associated with very high volume, confirming the weight of selling in the move lower. However, the price action also moved outside the average true range, and duly triggering the volatility indicator, so we can expect to see some consolidation in this region with a possible retracement back into the spread of the candle. But, with the technical pressure now weighing heavily and with the volume point of control firmly above, the longer term outlook now looks increasingly bearish, and if the $1260 per ounce area is taken out, then a move to test the lows of May in the $1210 per ounce area look increasingly likely.
(Click on image to enlarge)
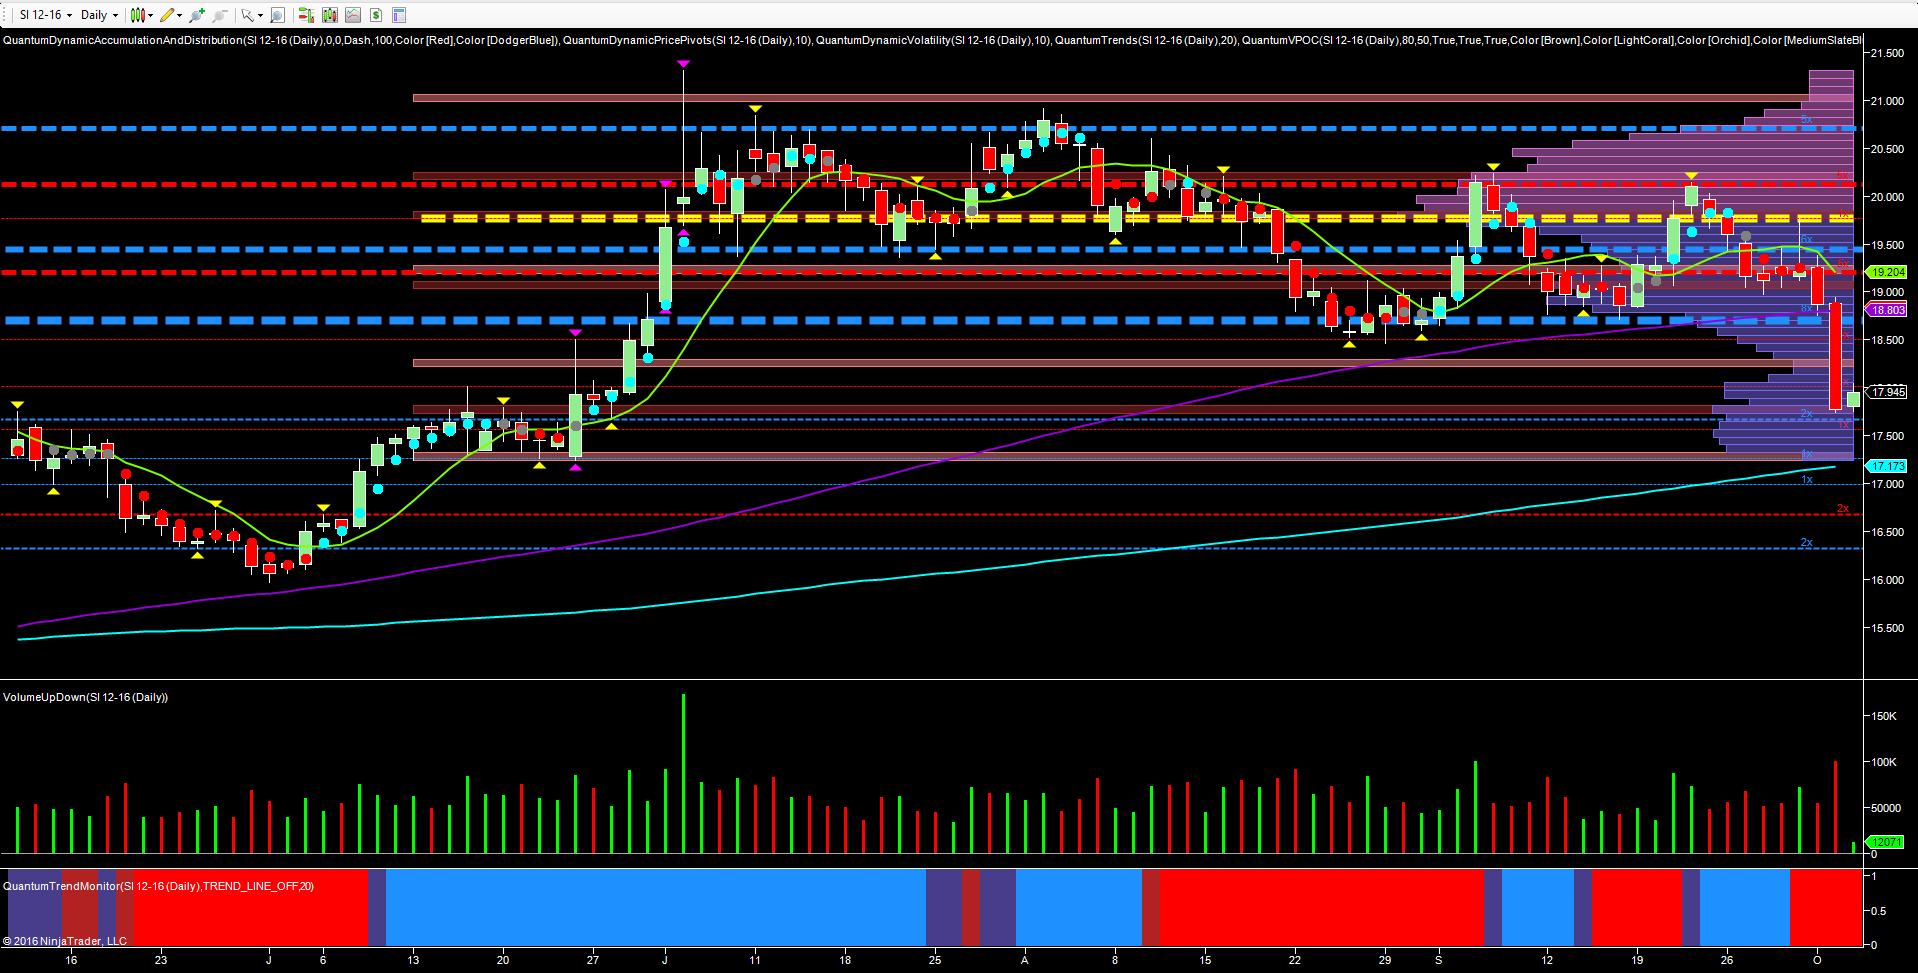
For silver the price action both before and after was almost a carbon copy, with the platform of support building in the $18.70 per ounce area and denoted with the heavy blue dashed line of accumulation. Again, this was a price region that had been tested several times, and until yesterday, had held firm, but was breached with the wide spread down candle as the metal closed at $17.77 per ounce. As with gold, the technical pressure now bearing down on silver is immense, with the volume point of control above, coupled with strong resistance overhead. Volume too was high yesterday and confirming the heavy selling and once the $17.60 per ounce area is taken out, then a move to test $17.20 per ounce is likely, with a deeper move then in prospect.
Disclaimer: Futures, stocks, and spot currency trading have large potential rewards, but also large potential risk. You must be aware of the risks and be willing to accept them in order to invest in ...
more

