
What’s Ahead For Gold Prices? Gold Bugs Must Remember 3 Things

iStock.com/frender
Gold Prices Remain Severely Undervalued
Gold prices aren’t moving. We’ve seen the precious metal trading sideways for several weeks now. Is it time to worry?
There are three things that gold investors must understand.
First things first, patience is key with the precious metal.
Those who are thinking long-term could reap massive rewards. Daily and weekly fluctuations are the result of noise and speculation, and nothing else. Getting worried about what’s happening in the short term could be a big mistake.
Second, it’s important for gold bugs to stop comparing gold prices to other assets.
For example, don’t compare gold prices to technology stocks; they are two different things.
It’s important to think from a valuations perspective and look at what’s happening in the gold market: gold remains severely undervalued. We see a massive demand and supply disparity in favor of the bulls. This disparity alone could send gold prices surging to all-time highs in a few years.
Technical Analysis Suggests that Prices Remain in Favor of the Bulls
Third, know that not much has changed when we look at the price of gold from a price action point of view. In fact, price action suggests that bullish sentiment prevails.
Look at the long-term chart of gold prices. The blue line represents the 50-month moving average of gold prices and the red line represents the 200-month moving average.
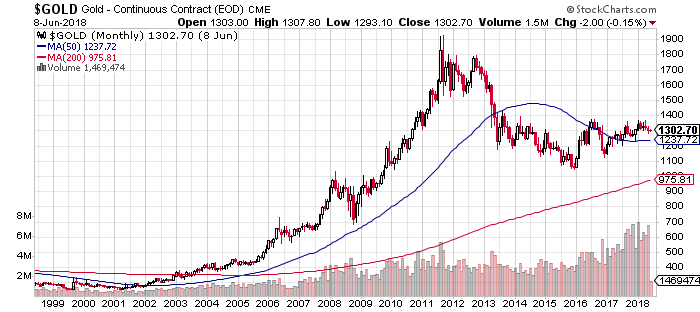
Chart courtesy of StockCharts.com
There are three other things that investors need to watch closely.
- Notice the 200-month moving average? The price continues to trade above it. At its core, this says that the very long-term trend of gold prices continues to point upward. If the precious metal price breaks below $975.81, then it’s really time to worry.
- Note that, in 2013, gold prices broke below the 50-month moving average. This was bearish and suggested that the intermediate-term trend was bearish. Now we see that prices are above this moving average. This says that bullish sentiment is building up and that the intermediate-term trend is pointing upward.
- Pay close attention to the volume plotted at the bottom of the chart. It’s important to know one thing: there’s more volume in the gold market these days than there was back in 2013.
Why does this matter? It says there’s a lot of activity. And with a lot of activity, the price has generally increased. This means there are more buyers than sellers in the gold market, and it is very bullish.
What to Watch for Regarding Gold Prices
Dear reader, it can’t be stressed enough: ignoring gold prices at the current level could be a big mistake.
I see the yellow precious metal as a great opportunity—better than stocks for the next five years, at least. I know it’s a bold statement, but I am willing to stand behind it.
Again, patience is the key.
There are four key levels I am paying close attention to when it comes to gold prices.
- If gold prices break below their 50-month moving average ($1,237), I’d be slightly worried.
- Prices breaking below the 200-month moving average would mean an extreme bear market.
- On the upside, I am paying close attention to the $1,350–$1,375 level. If the yellow precious metal breaks above this level, there isn’t any resistance until $1,550.
- If the price breaks above $1,550, we could see fireworks in gold prices.
Disclaimer: There is no magic formula to getting rich. Success in investment vehicles with the best prospects for price appreciation can only be achieved through proper and rigorous research and ...
more

