
Upcoming Turnaround In Gold
More than two weeks ago, we described the very specific and very important pattern in the gold market, one of short- and medium-term importance. We wrote that the triangle apex pattern based on the intraday highs pointed to a major reversal in the first half of March. The first half of March ends this week, so the key question is if the pattern was invalidated or are we about to see a major reversal in the price of gold.
In our view, the latter outcome is highly likely as it is confirmed also by other – independent – analogies. Let’s start with going back to the chart that we presented on February 26th (chart courtesy of StockCharts).
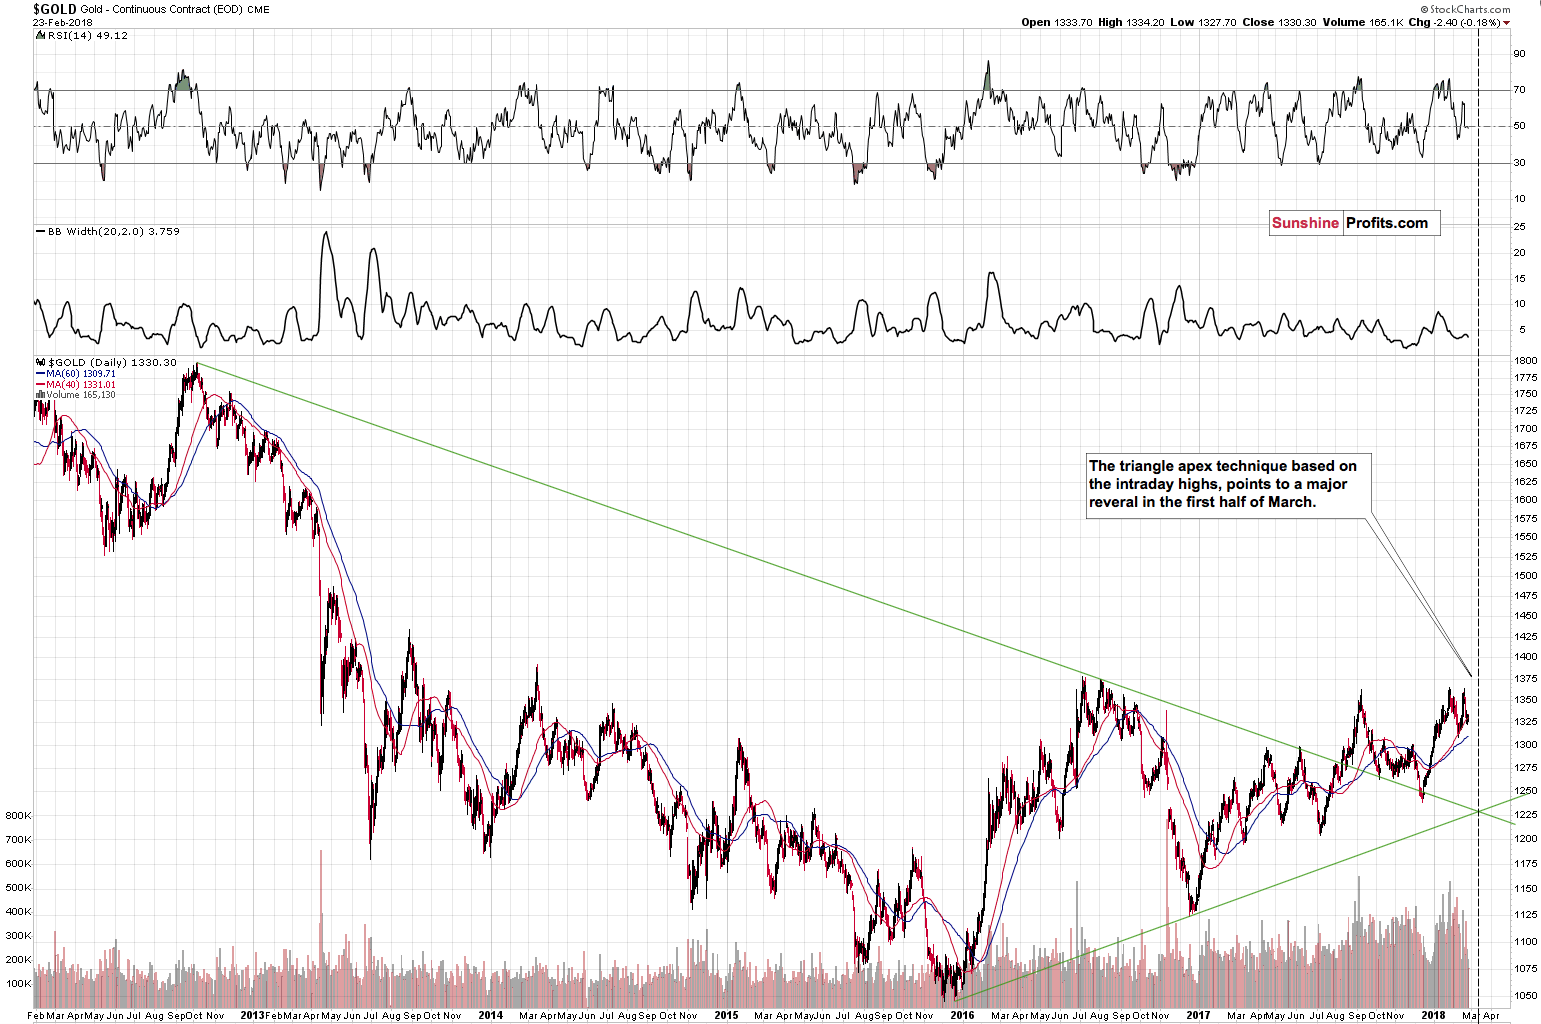
In the past two weeks gold didn’t soar – conversely, it was trading sideways and its currently lower than it was when we wrote the above. So, one might be wondering if the implications of the triangle’s apex are actually bullish since the move in the last two weeks was down. They are not because this gold forecast technique is based on medium-term lines, so we should also take medium-term rallies and declines into account while determining the implications of the turnaround.
The preceding medium-term move was up – gold moved higher in late December 2017 and for most of January 2018, topping a bit above $1,360. The back-and-forth movement since that time is rather a lengthy medium-term topping formation than a combination of price moves that should be analyzed independently – at least from the medium-term point of view.
Of course, if gold breaks above the $1,360 with a vengeance and confirms a big breakout above it, then the current back-and-forth trading will turn out to be a consolidation within a rally – but that’s not what seems likely at all. After all, gold wasn’t able to break above its 2017 and 2016 highs even though the USD Index declined a few index points below the analogous extremes.
The medium-term nature of the pattern has an additional important consequence. It is that we shouldn’t put too much weight on its precision in terms of days. A good rule of thumb is to zoom in or out on a given chart until the pattern that you want to analyze is clearly visible and then check – without zooming in – if the price is just a bit away from what it should be doing based on the pattern, or not. In the case of our triangle apex reversal, the moment of reversal is “more or less here”, so if we see a reversal this week, it will be definitely in tune with the pattern – it will not invalidate it.
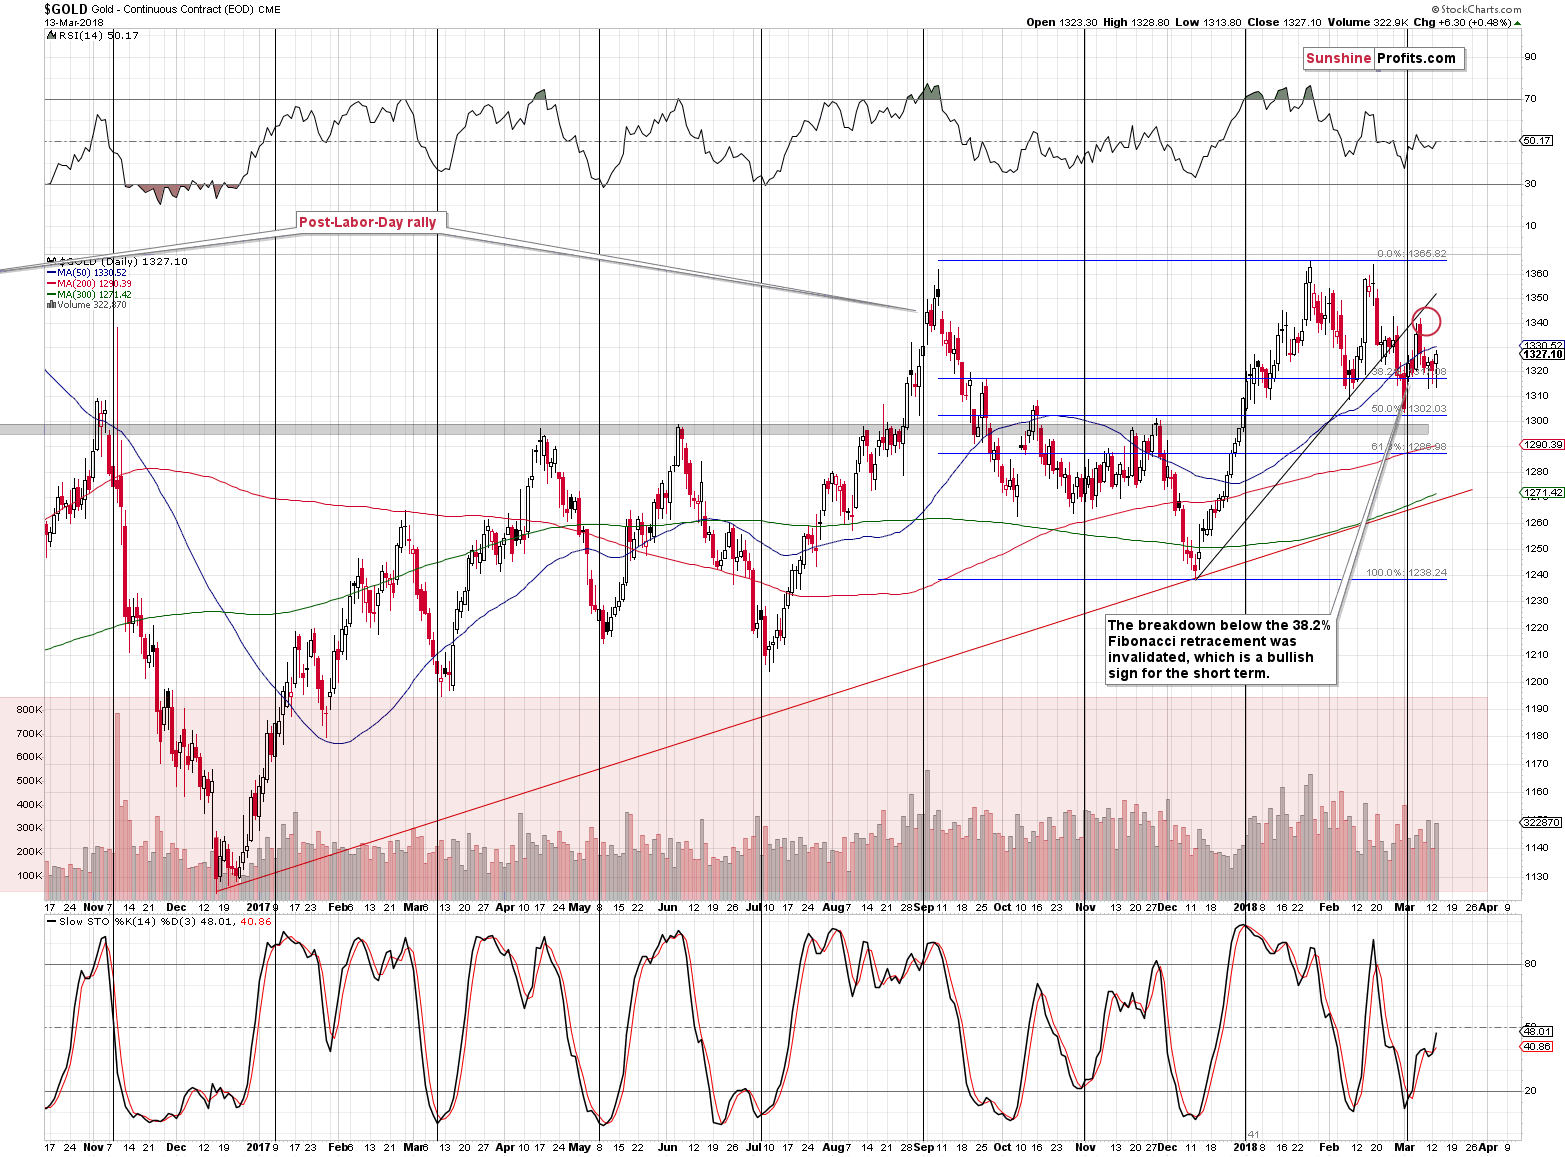
During yesterday’s trading gold moved higher without moving back above the 50-day moving average. If we are to see a major reversal and a powerful decline thereafter, then we should see/have seen at least some upswing beforehand. After all, what’s to reverse if there was absolutely no rally? Consequently, it seems that yesterday’s rather small upswing is perfectly understandable in the current market situation. Besides, we wrote in the previous analyses that slightly higher prices could be seen. This seems to be it. We don’t expect significantly higher gold prices before the reversal, though.
Earlier today, we wrote that the bearish case is supported by also other analogies. One of them is to the previous breakdown below the 50-day moving average.
Back in early December 2017, the breakdown below the 50-day MA was followed by a brief pause and the decline continued only after that time.
This is something that we’re seeing also this time – the pause and a small rally is a verification of the breakdown below the MA, which is a bearish gold trading sign.
Silver’s Striking Similarity Continues
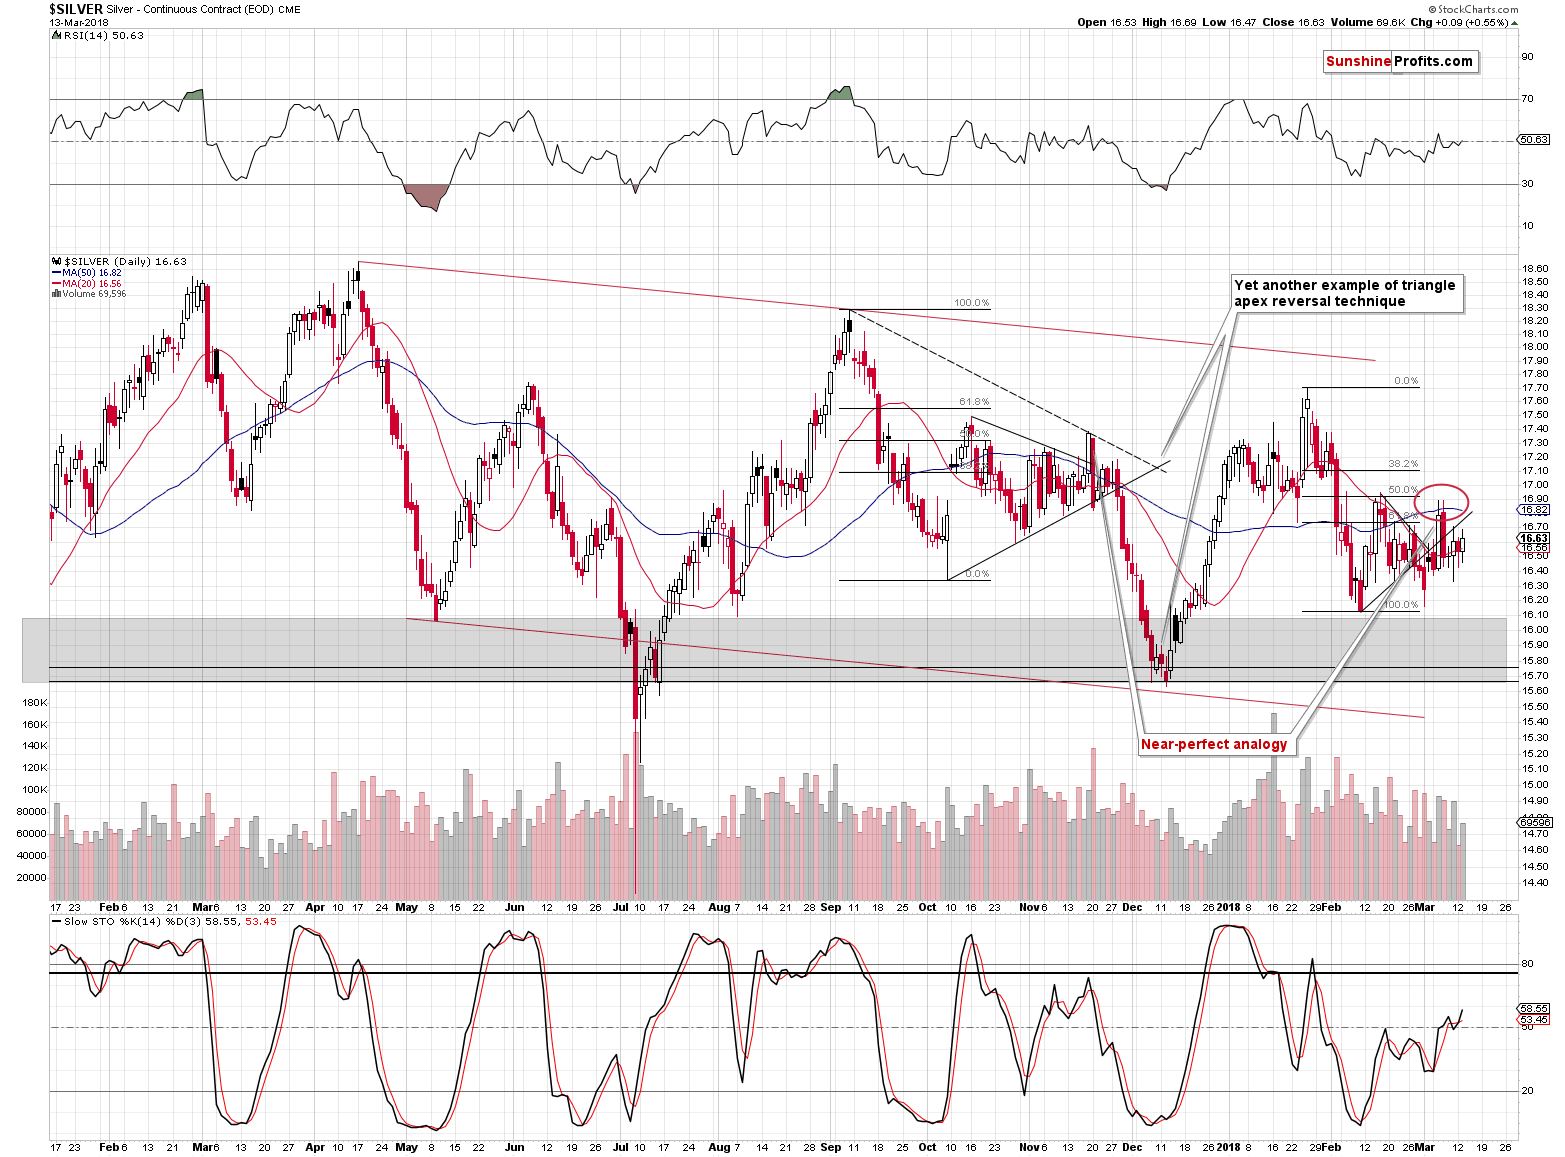
The second analogy can be observed in the silver market. In the past few weeks, the white metal has been performing almost identically as it did after the September 2017 top. The initial decline, the volatile comeback and another move lower, but not below the initial low. Then a sharp daily upswing above the 50-day moving average and almost to the previous high. Then another big move down that erases more than the daily rally. Finally, a few days of quiet upswing. That’s where we are right now and that’s exactly what preceded the $1.5 decline in late 2017.
The above paints a clearly bearish forecast for silver.
Gold Stocks’ Breakdown Below 2017 Low
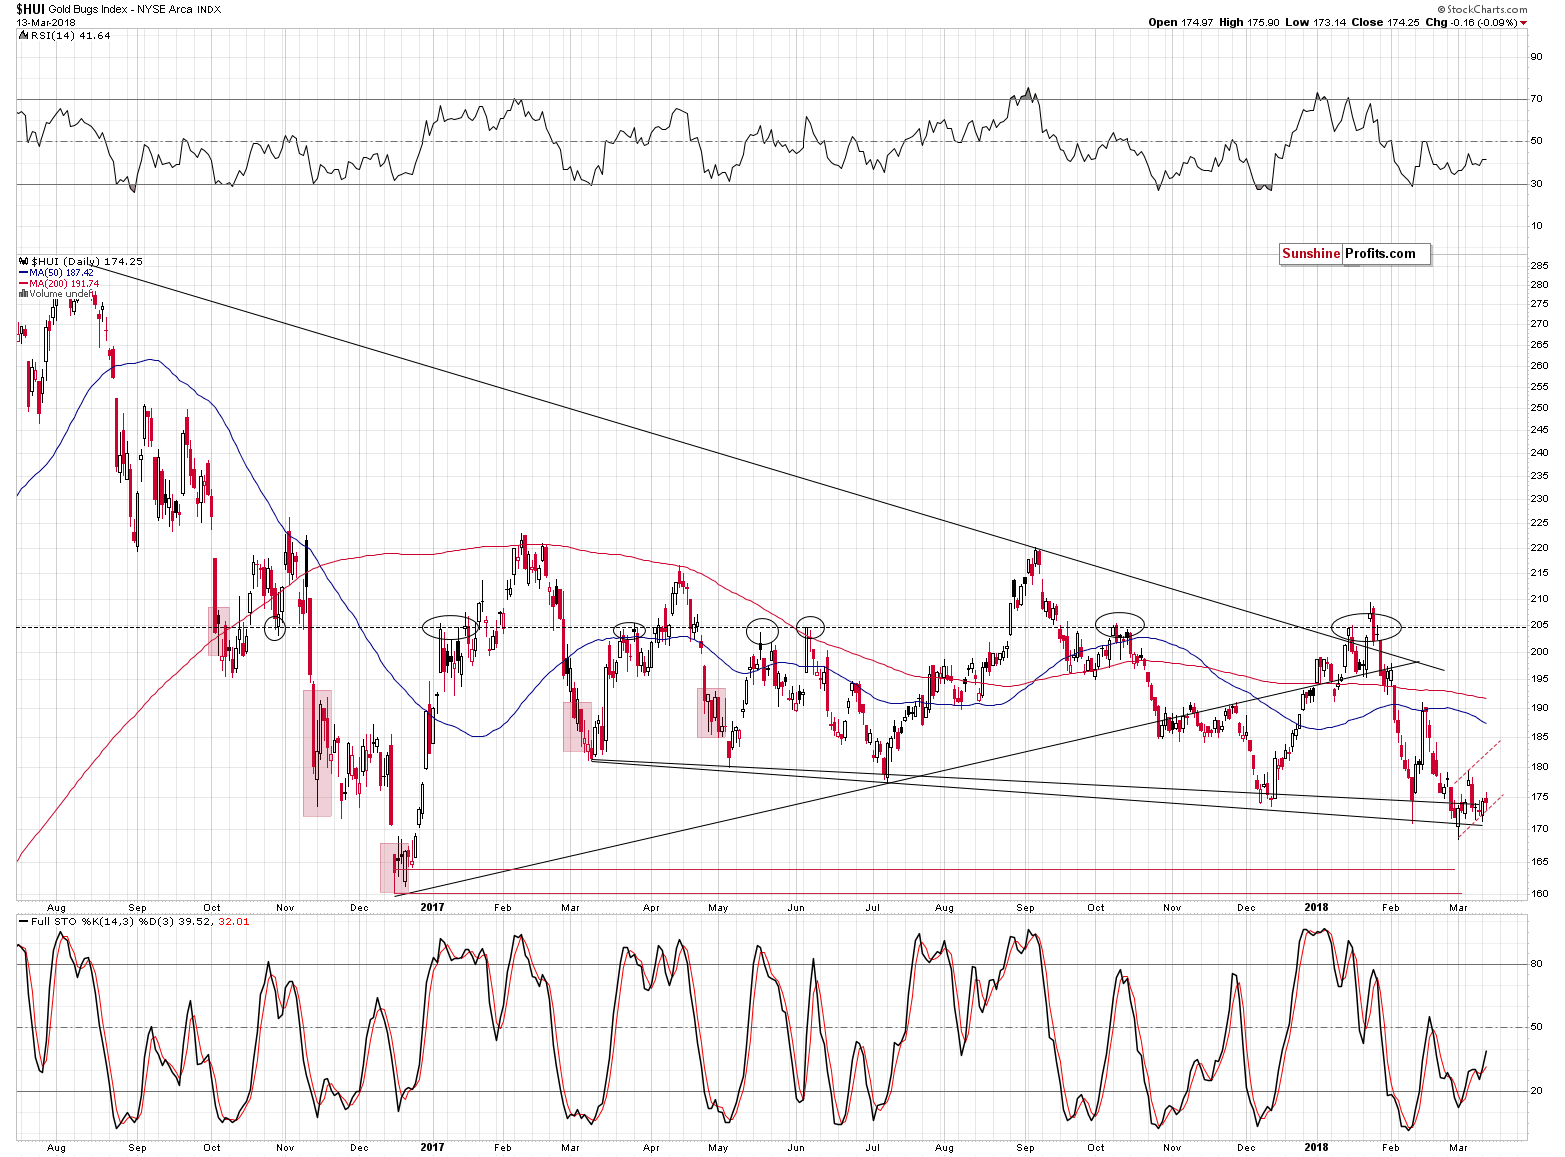
In yesterday’s Gold & Silver Trading Alert, we wrote that based on the analogy present in silver, the one in gold and due to gold’s triangle apex reversal, it seemed that the chance of another upswing was very low. Even if it was seen – we argued – gold miners would be likely to underperform, so a move to a new March 2018 high didn’t seem to be in the cards.
Yesterday’s session more or less confirmed the above. Gold and silver moved a bit higher just as one might have expected them to before a reversal, and silver moved in tune with its self-similar pattern. Gold stocks, however, ended the session slightly lower, underperforming and closing once again below the 2017 low.
It seems that the breakdown below the last year’s low is now more than verified and thus much lower prices are likely to follow.
Sign from Europe
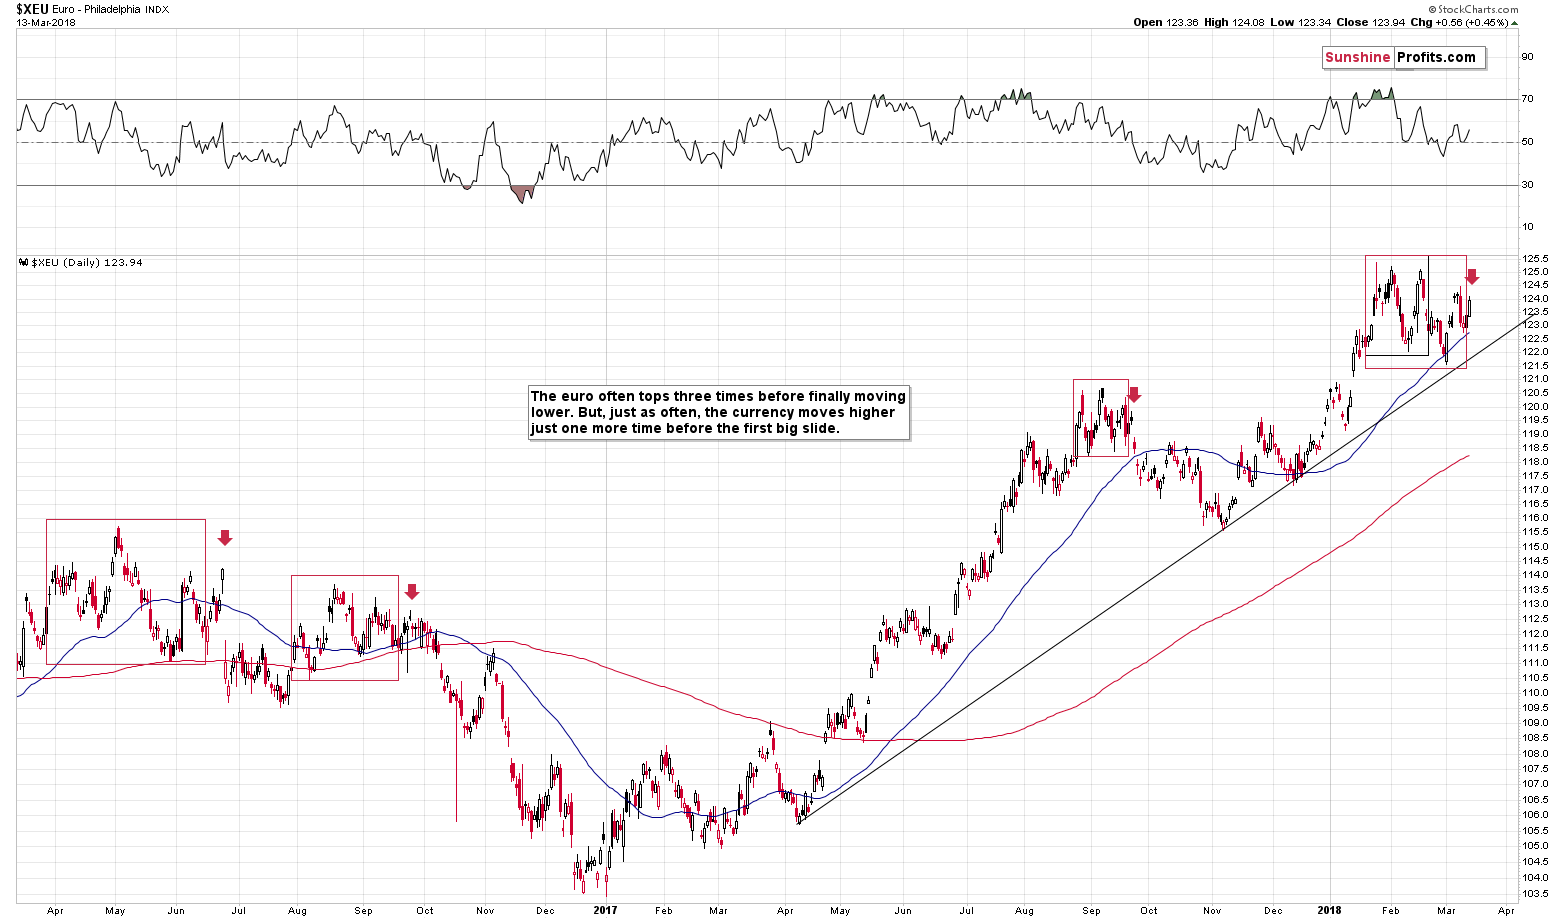
The interesting pattern about the euro is that it quite often ends rallies with triple tops with an extra upswing that sometimes is too temporary to be called another top. We marked those cases with red rectangles and we marked those “extra upswings” with red arrows. The temporary nature of the latter can be seen particularly clearly in September 2017.
On Friday, we wrote that the problem with this analogy and the reason why it didn’t add clarity to the outlook was the January 25th intraday high. Should we count it as one of the major local tops?
Yes, because ultimately a high was indeed reached. No, because in terms of the closing prices, nothing really happened on that day.
Based on the most recent very short-term move higher in the EUR/USD, we know that the second interpretation was most likely the correct one. Namely, the intraday high didn’t really count and that the top we saw earlier this month was the third one. This, in turn, makes yesterday’s rally the “extra upswing” that is seen right before declines. The implications are bearish for the EUR/USD, bullish for the USD Index and bearish for the precious metals market.
Summary
Summing up, a major top in gold, silver and mining stocks is probably in, and based on the way silver and gold stocks performed on Friday and the analogies in gold and – especially - silver, it seems that the big decline is just around the corner. We already saw the key short-term signs: silver’s outperformance and miners’ underperformance last Tuesday, and the fact that they were repeated on Friday makes the bearish outlook even more bearish, especially that our last week’s upside targets for gold and silver were already reached.
The above is up-to-date at the moment of publishing it and the situation may – and is likely to – change in the future. If you’d like to receive follow-ups to the above analysis ...
more

