
Technical Update: Bull Flag Setting Up In Gold
Gold’s (XAU/USD) behavior over the past seven months continues to point to an eventual rise to higher prices.
The precious metal broke out of a large bullish descending wedge pattern in February and has trended higher since. Resistance was most recently seen at 1,375.15 in early-July, thereby completing a 38.2% Fibonacci retracement (1,380.56) of the full decline off the 1,920.94 September 2011 high. Subsequently, we entered a retracement and consolidation phase with gold forming a potential bullish flag trend continuation pattern. During the pull-back support has been seen at the 21-week exponential moving average over several weeks and has held. The low of the retracement is at 1,302.61.
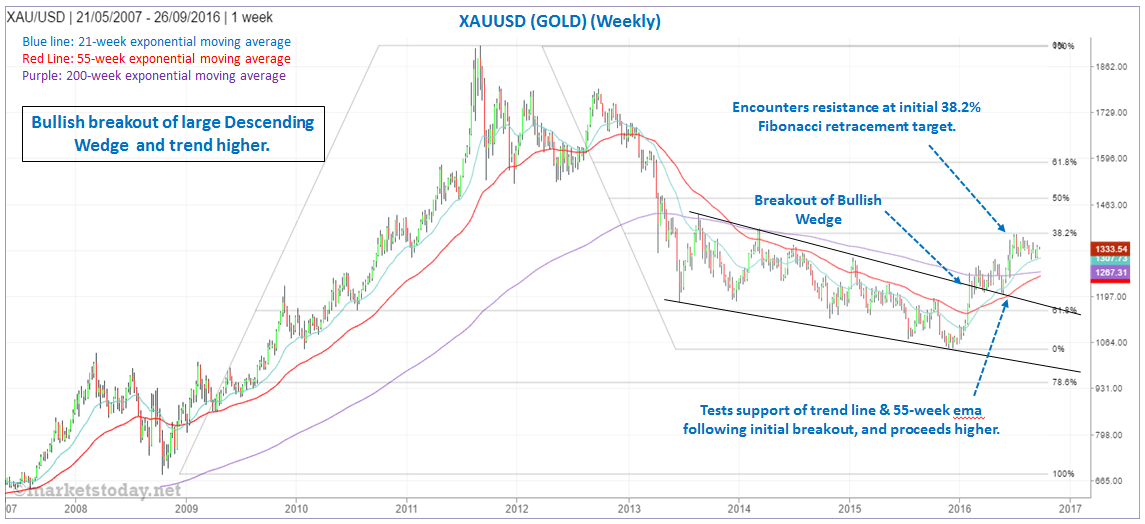
A bullish breakout of the flag would be indicated on a decisive rally above 1,352.61, while a drop below 1,302.61, indicates the flag is not yet complete. Lower prices would indicate that the pattern could be expanding or is evolving into a different pattern. A drop below the recent low could easily lead to the 200-week ema, now at 1,267, or the 55-week ema at 1,255.
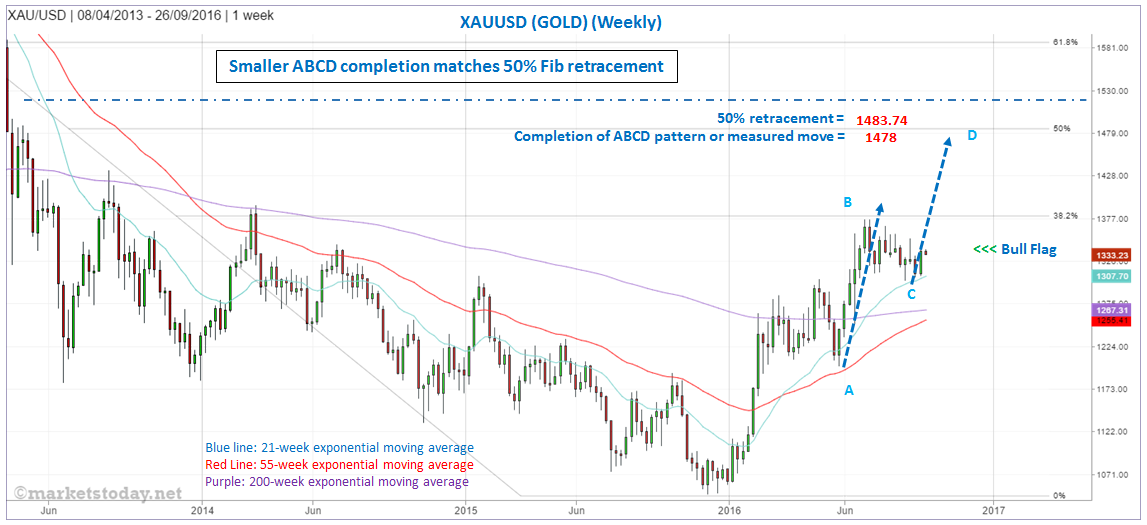
If a bullish breakout occurs the 50% retracement price zone around 1,483.74 looks to have a good chance of eventually being reached especially since the 38.2% target was almost an exact match with the most recent peak, even though it’s derived from a multi-year time frame. The potential significance of the 50% target area is enhanced by the fact that the more recent ABCD pattern completion or measured move is close by at 1,478, as can be seen in the chart above.
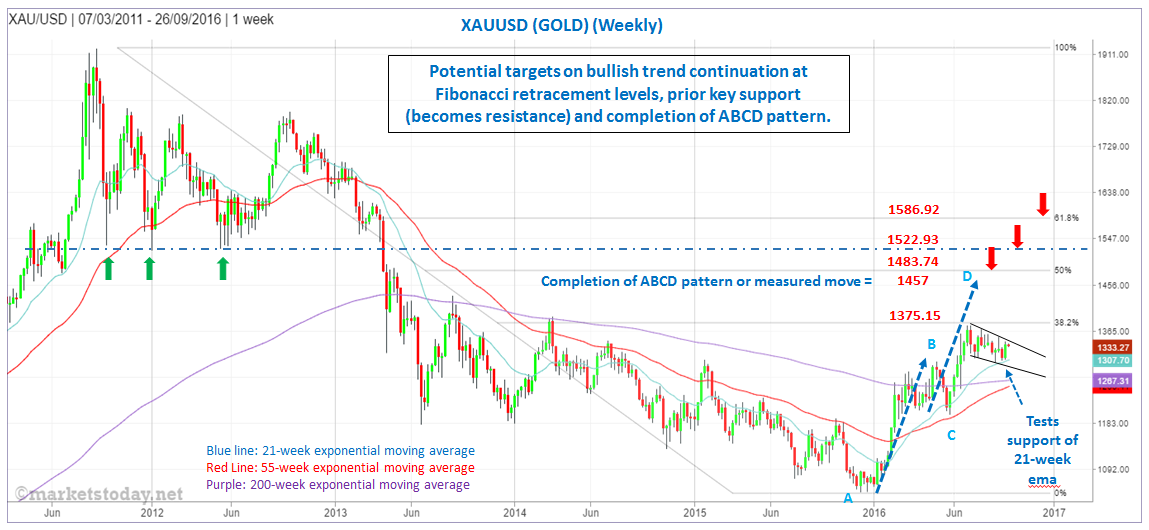
Other potential target levels are indicated in the chart below.
Disclaimer: The views and opinions expressed here are solely those of the authors / contributors and do not necessarily reflect the views ...
more

