
Subconscious
Have you ever heard someone say, “In the back of my mind, I was thinking about…” ? Well, in this report I’m going to discuss my analysis ( technical / Cycles / etc) and the conclusions that are drawn from that, but I also wanted to mention a few things that have subconsciously been 'in the back of my mind ‘ in a few areas.
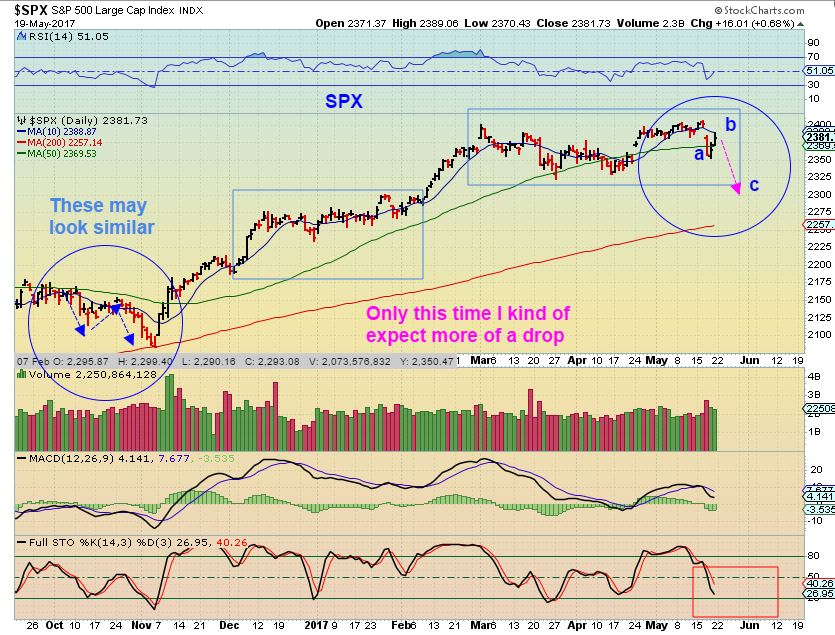
SPX – Friday I pointed out that we could bounce here, but I still expect a bit more of a drop after a bounce.
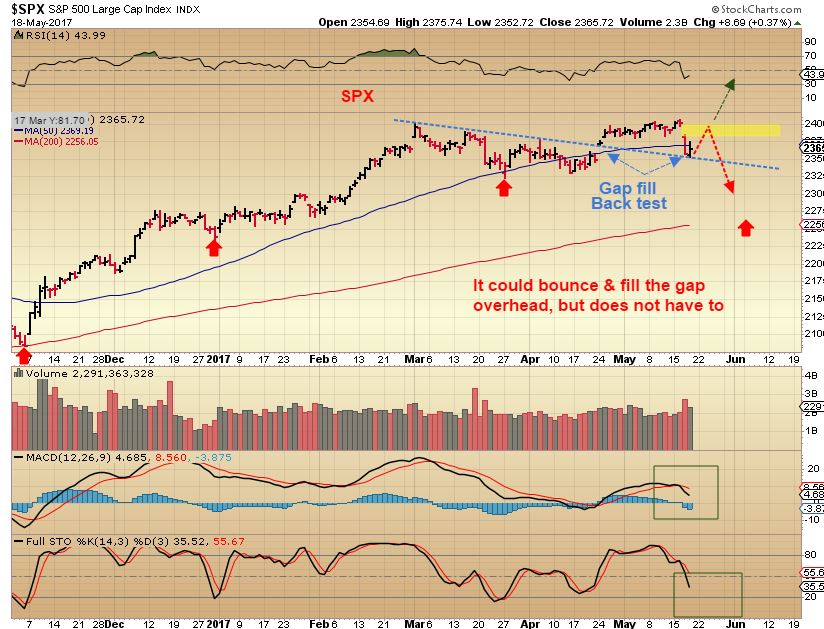
We did get the bounce at multiple support areas after filling a lower gap & ‘buy the dip’ has been working. Now we could fill the overhead gap.
These patterns do look similar with a continuing rally, and some may think that it would lead to further rally upside.
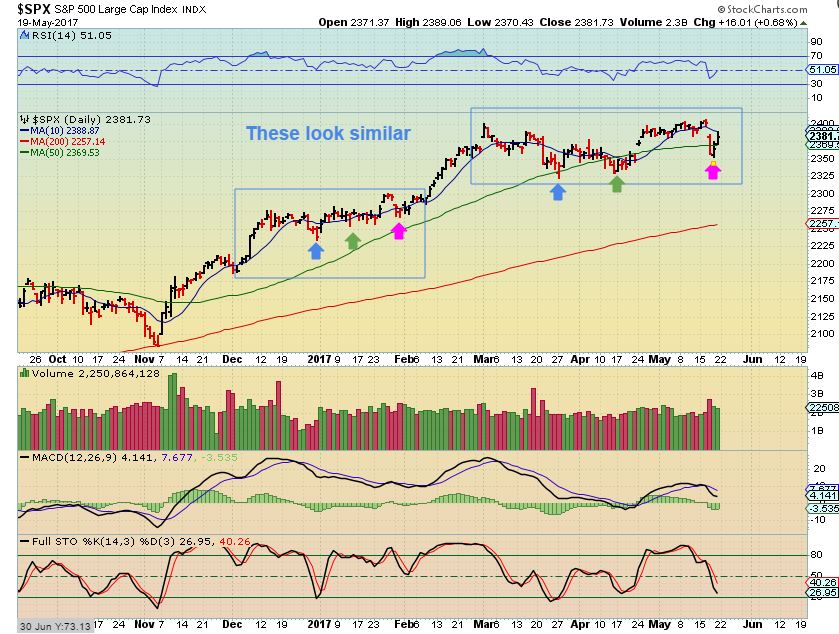
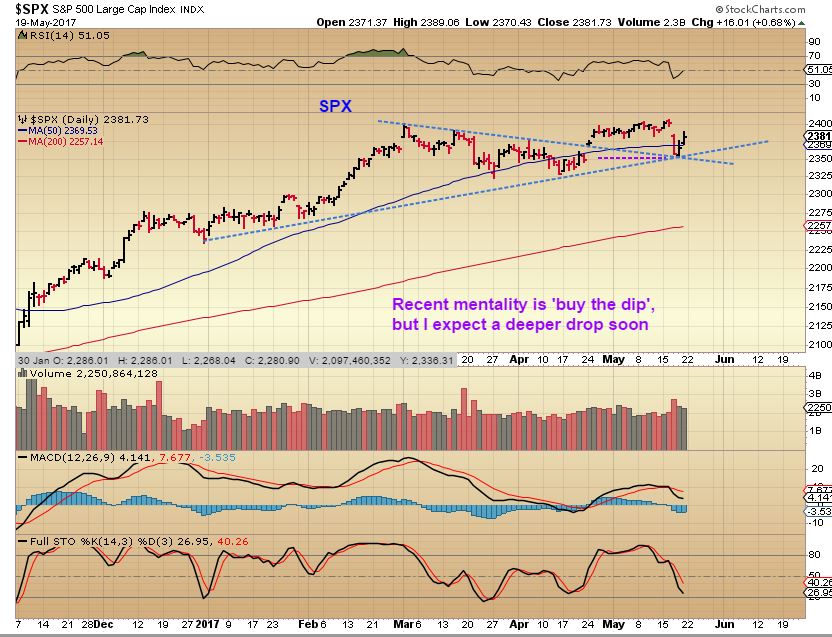
But ‘in the back of my mind ‘…I expect a deeper dip for now due to cycle timing, eventually into an ICL. I pointed that expectation out here on May 12.
I would be expecting maybe something a little like this.
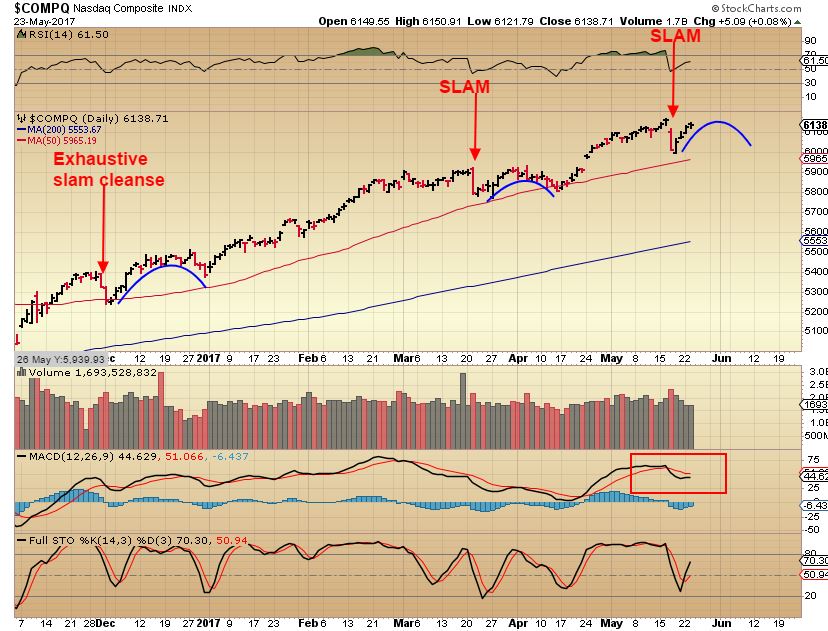
UPDATE: I added this chart to my Wednesday report, where we see a flush like slam that cleans the plate of sellers short term, and then a gradual bounce and dip.
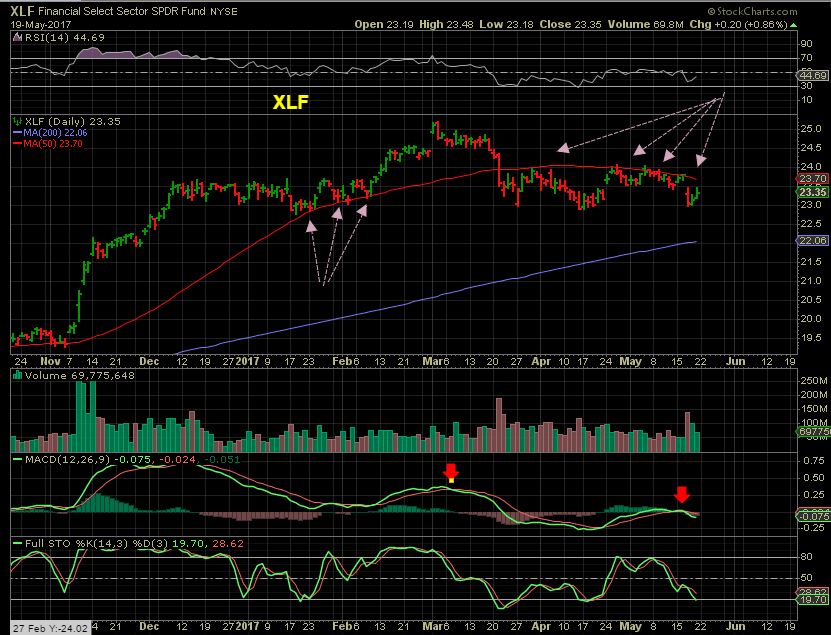
XLF –The fact that the financials still haven’t recovered the 50sma is always ‘in the back of my mind’ too. I have pointed out this weakness, because the markets can still make higher highs for now, but if Financials fail, I would expect the general markets to follow sooner than later.
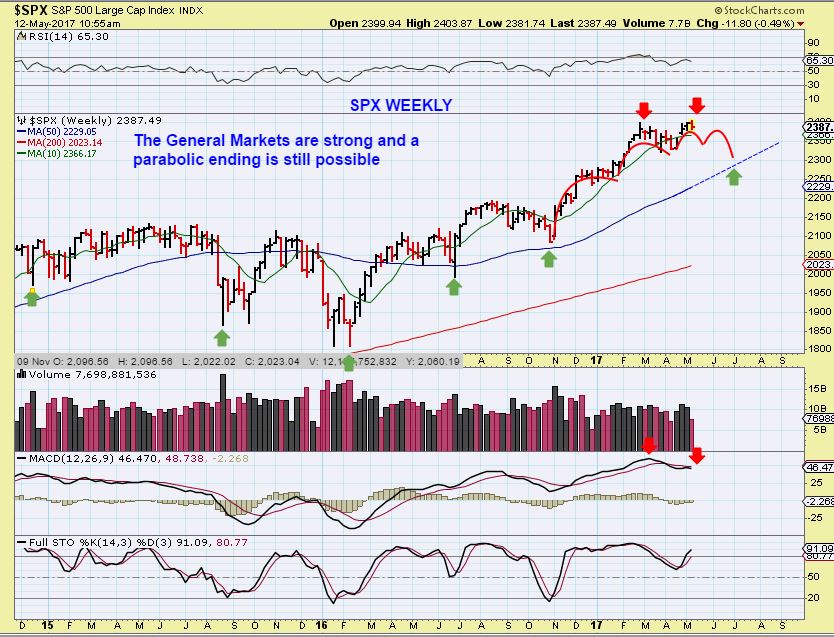
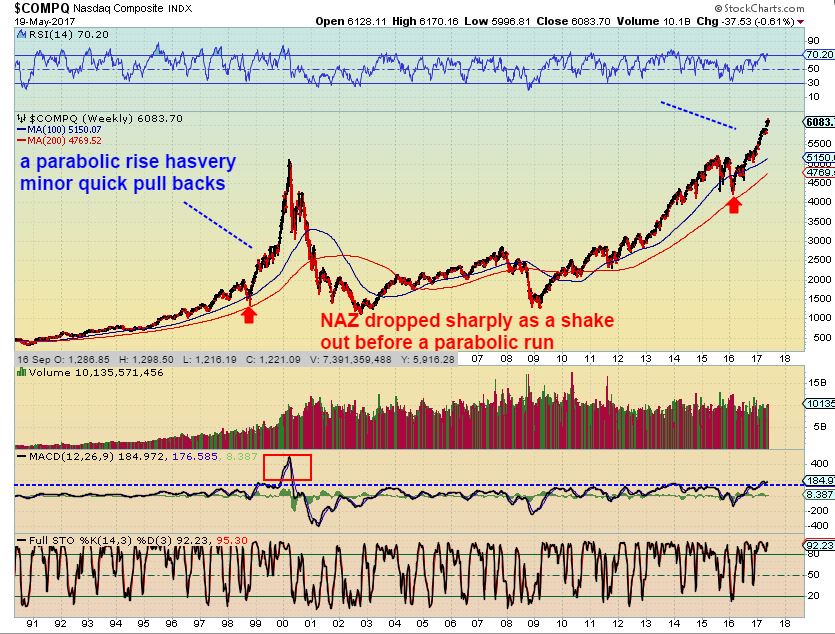
But by now you definitely know that also ‘ in the back of my mind ‘, I believe that these markets could have the potential to turn parabolic . They look very similar to the non stop rise in the Nasdaq 1999.
USD – The USD continues to down trend – putting in lower highs and lower lows. The daily cycle counts have extended to almost 40 days so we may have a dcl/ ICL ahead. ( See the chart).I expect an ICL in the USD soon. The inverse relationship between gold and the USD has not been present lately, but a solid move higher soon could still drop gold into the ICL move.
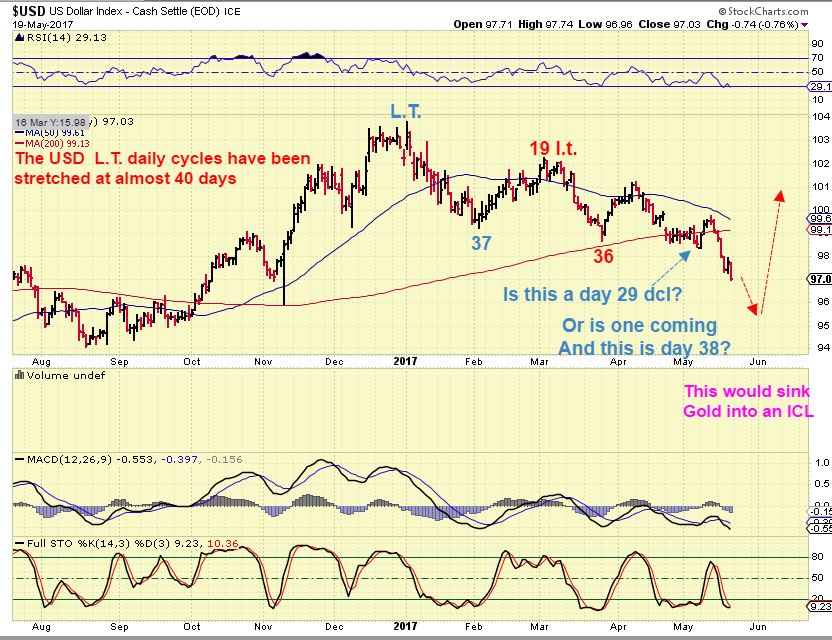
As mentioned, the relationship between gold and USD has disconnected from their normal inverse relationship. That adds a trickiness to the analysis too, because you used to be able to gauge one with the other. ‘In the back of my mind’, I feel that this constant drop in the USD should have pushed gold a lot higher, and in my analyses this backs up the idea that we still have a drop in Gold coming. More on that later.
My WTIC March 17 chart – I thought that Oil could drop as far as $42 – $44 area. Most of my charts back then showed a $42-$44 target last spring, as shown here.
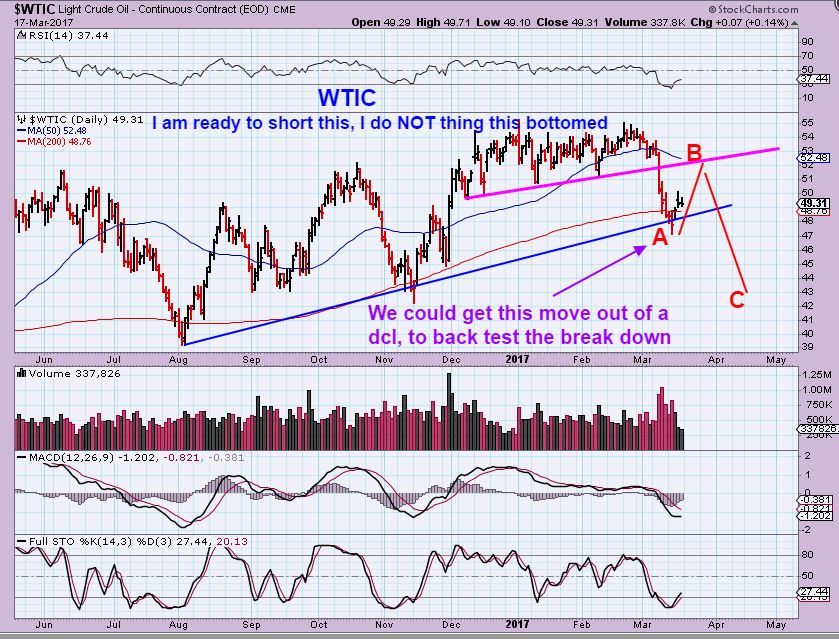
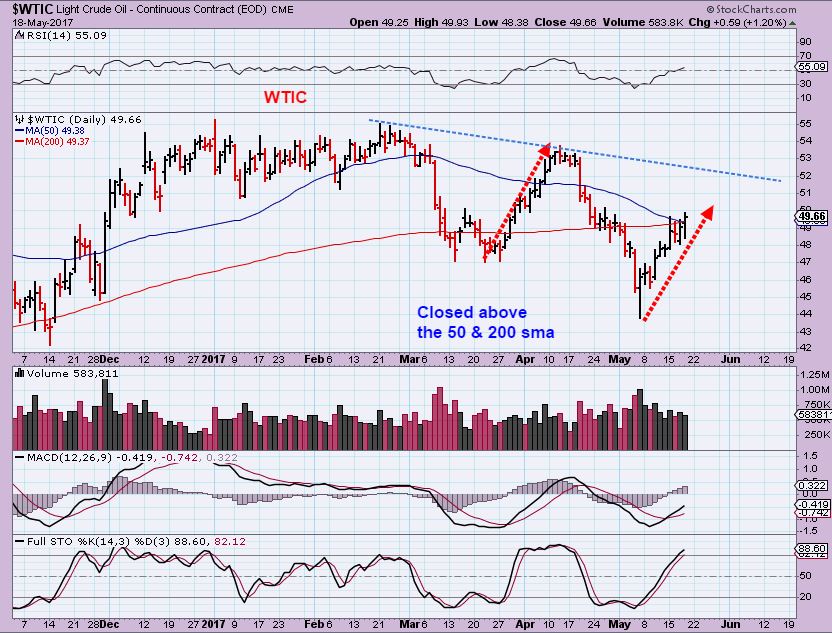
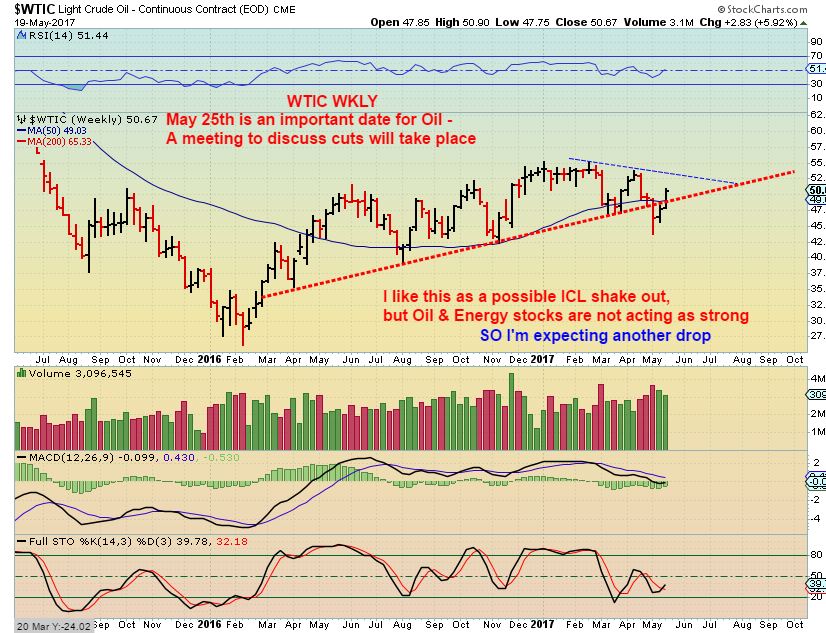
WTIC – Oil did hit $43.76. Is this rally the real deal, with final lows in place? I have my doubts, because many of the Energy and Oil stocks are still lingering at the lows. On May 25 there is a meeting that will discuss the possibility of more oil cuts and that meeting could affect oil. So far the blue line is a potential target this week.
OIL WKLY – It looks like a shake out and a bullish recovery, but we will see what happens on that May 25 meeting. That blue line could be the lower high top before another drop in oil.
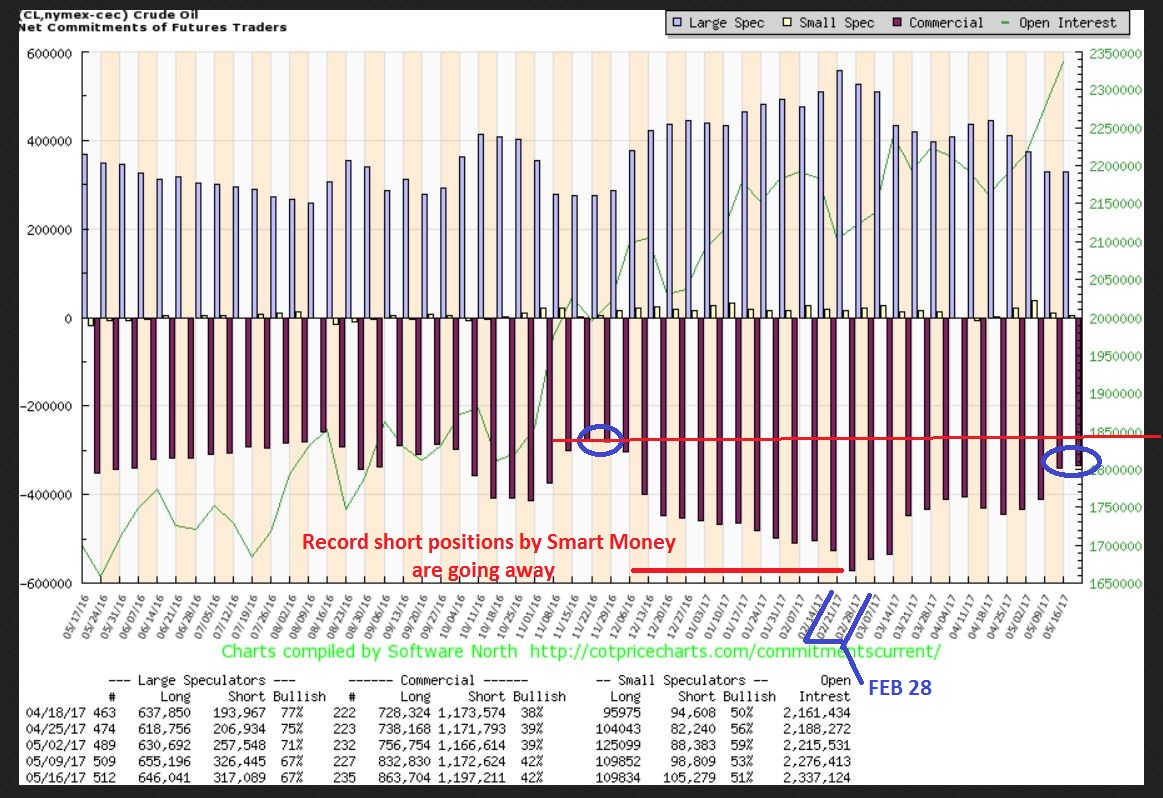
Look how much the OIL COT has improved as OIL dropped down seeking out an ICL. One more drop is possible and it could get it to the red line and put in an ICL.
So let's look at Energy / Oil stocks now.
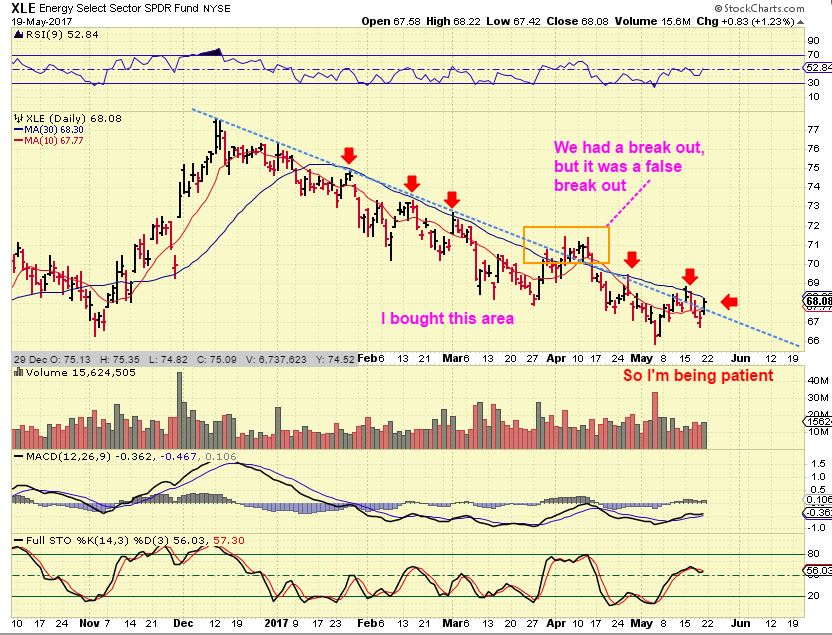
XLE – There was a false break out in April, and we can see that the blue trend line has now been broken again. The 50sma has not been broken yet, but it is close. (I accidentally used the 30 on this chart, but the 50sma is also still holding price down).
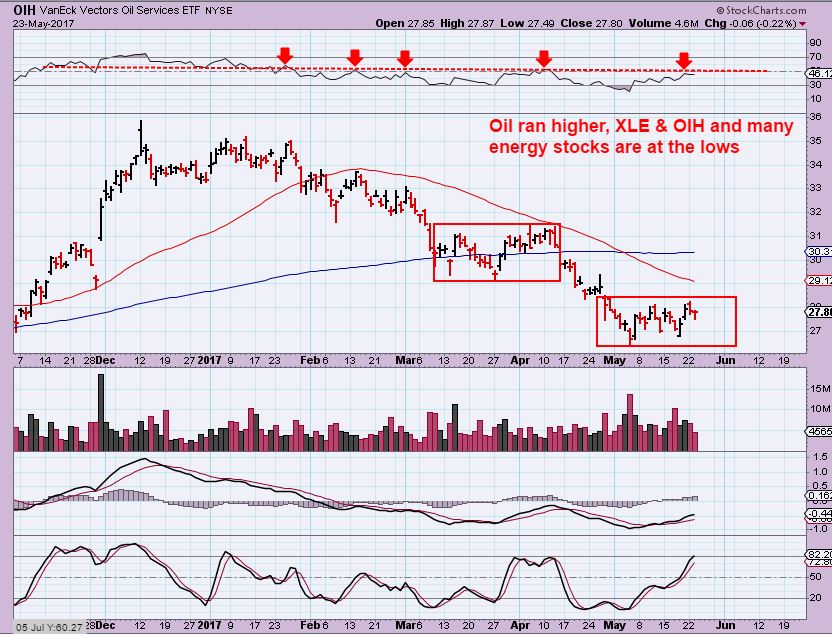
OIH UPDATE : I used this chart in the report Wednesday May 24. We are seeing that Energy stocks are NOT rallying like Oil, just like we saw this spring when Oil rallied. At this point, I am thinking that we get one more drop in Oil and the energy stocks bottom out.
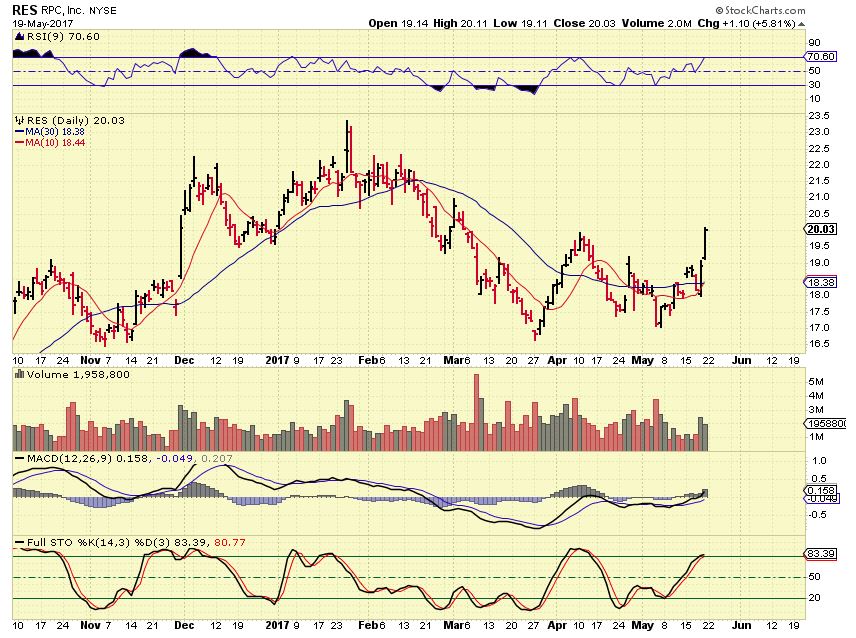
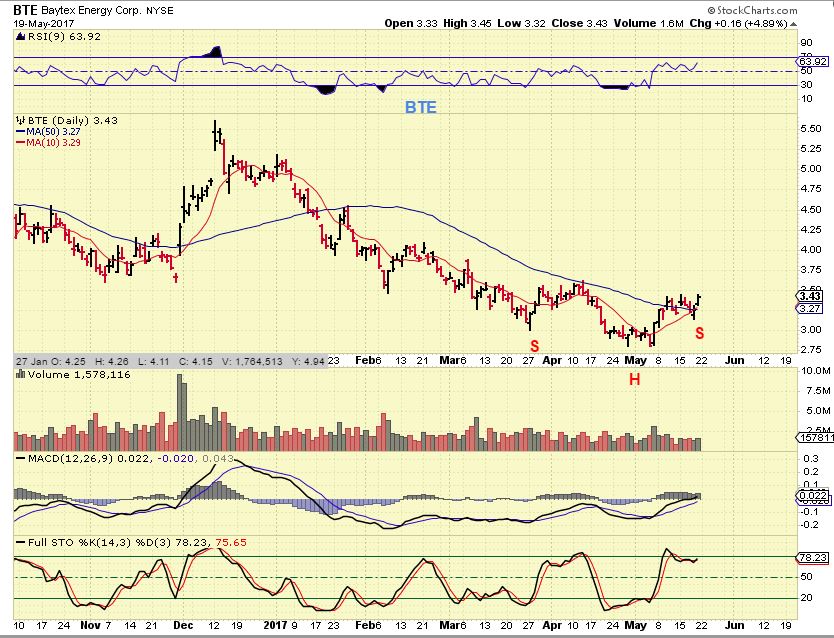
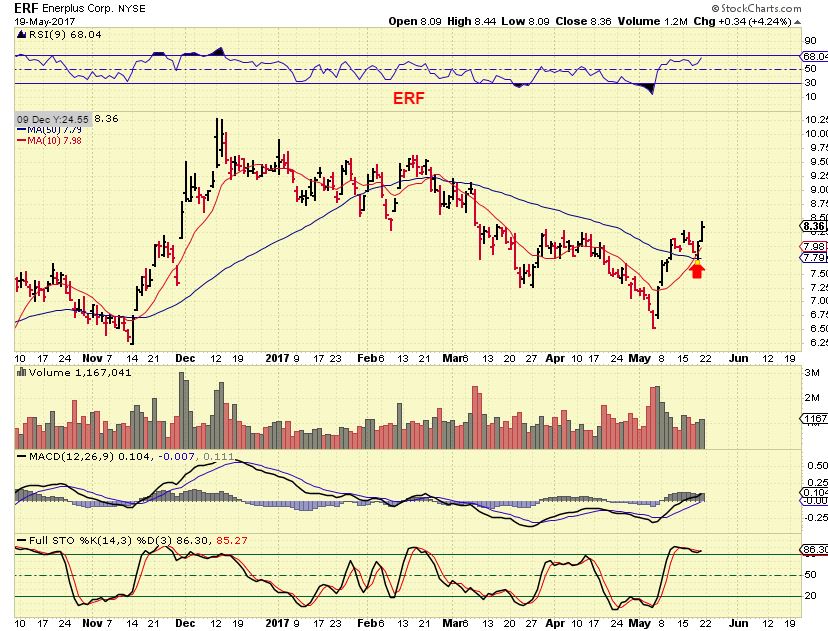
So you may recall this comment Thursday in the premium comments section. I stated that some ENERGY/ OIL stocks are improving while others are not. I mention here that RES, BTE, ERF actually look like BUY candidates, so do we have some leaders forming? Read the comment…
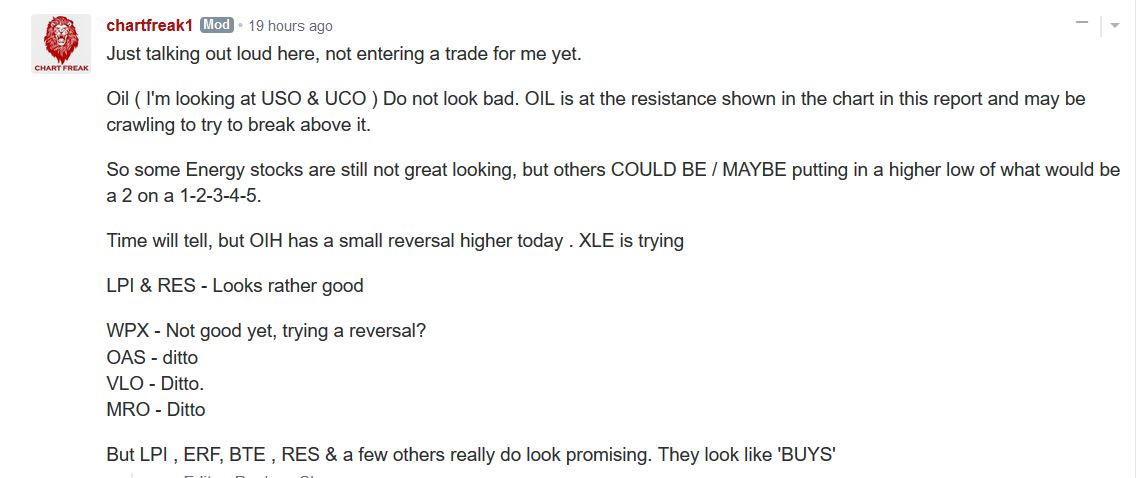
Let’s look at RES, BTE, & ERF and see if they had further follow through on Friday.
YES, follow through
YES –Still a nice set up.
Yes – so some areas may be shaping up quicker than others. I am now going to watch this sector closely for more signs of improvement. The Thursday May 25 Oil meeting may hold the key for Oil & Energy.
NATGAS WEEKLY – I did not re-enter my Long NATGAS position, and now I will not unless I see a drastic change. Why not? As mentioned on this chart last week, the break out on the daily chart was invalidated.
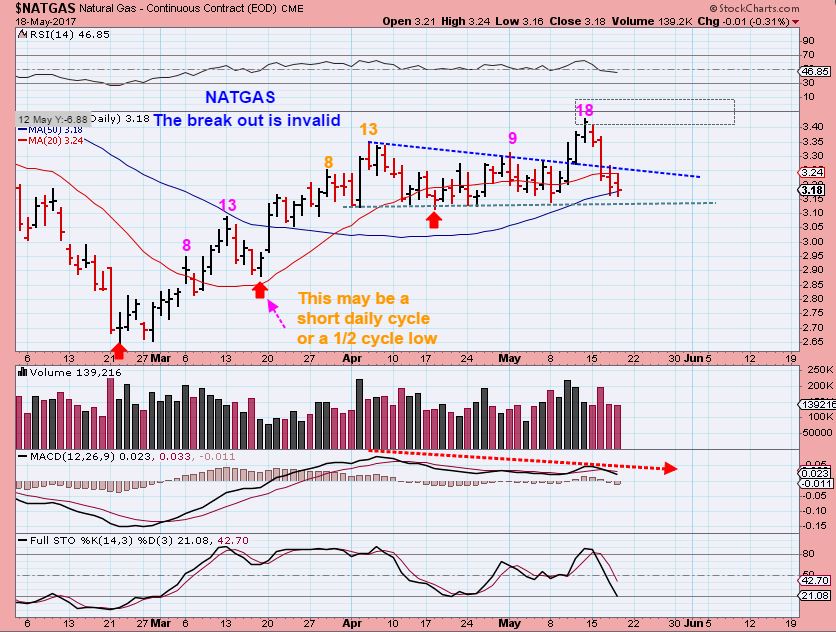
NATGAS WEEKLY -This still could be a H&S, but more importantly …
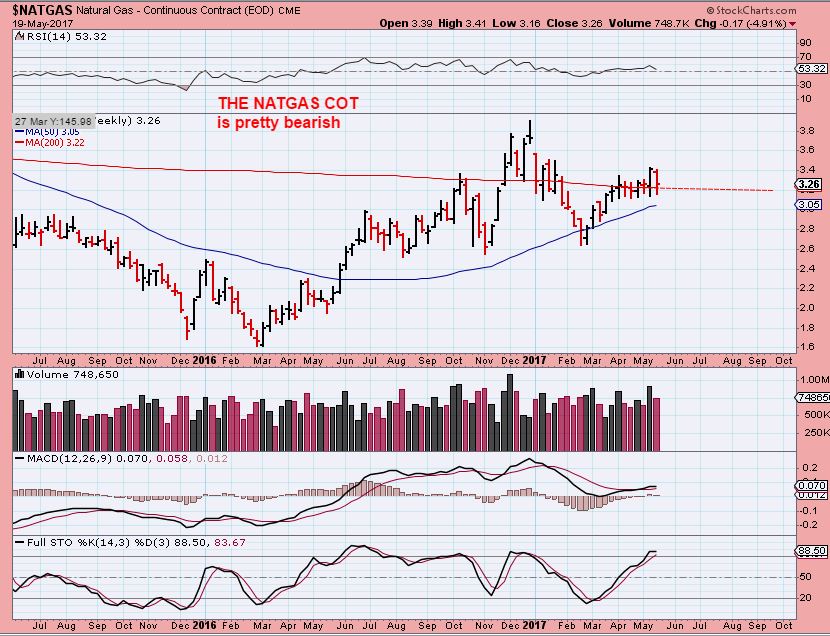
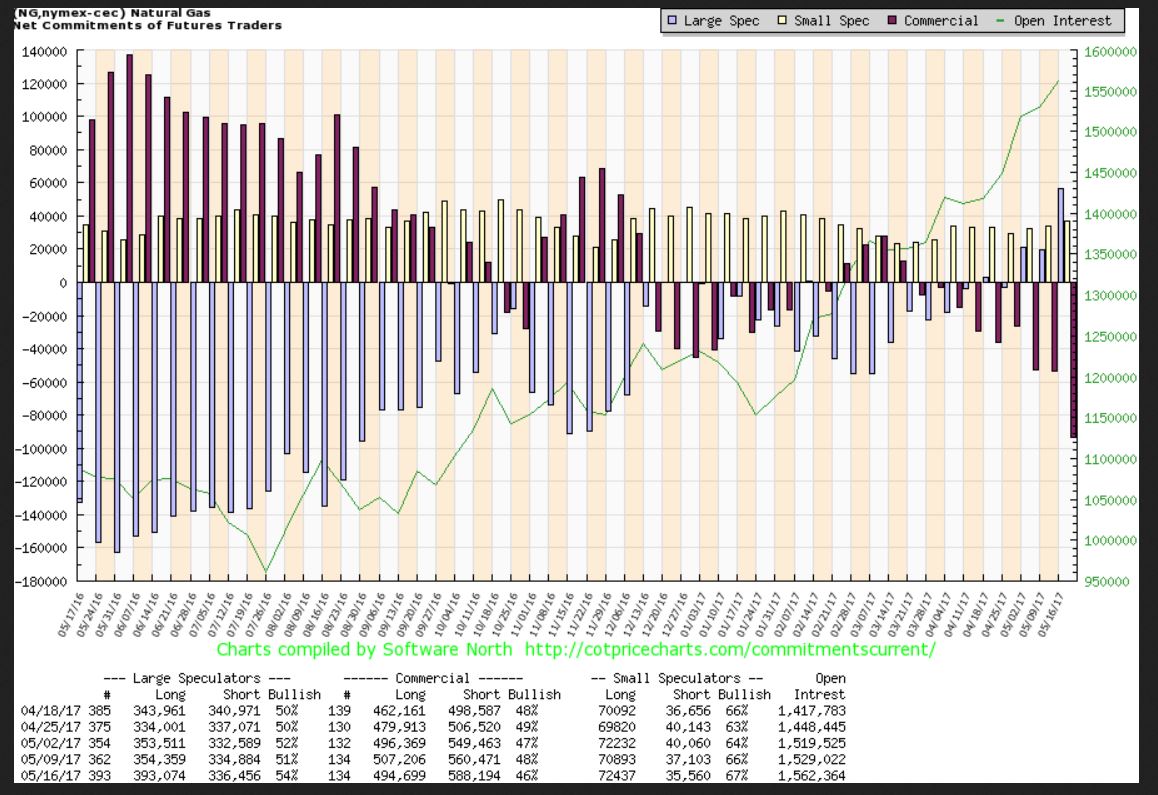
Look at the NATGAS COT now. Smart money really added to their short positions.
Commercials ( Smart money) The final brown bar on this chart occurred Last week and smart money went VERY SHORT. I have to heed this warning for now.
PRECIOUS METALS
GOLD, SILVER, and MINERS
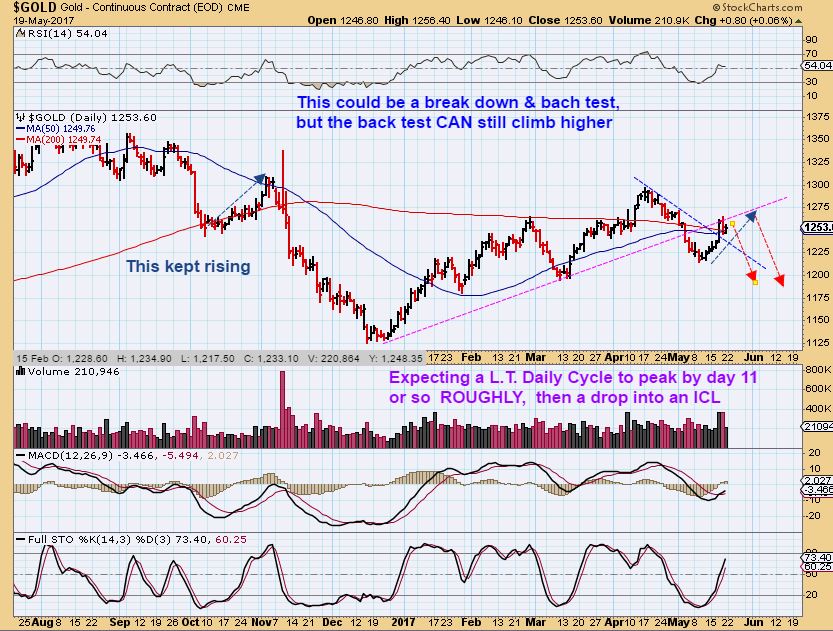
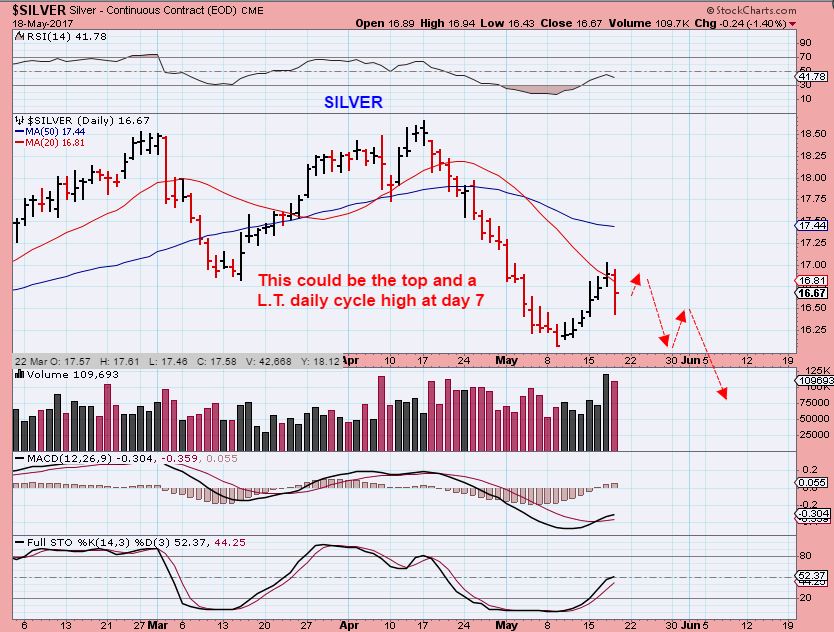
From Thursday, Gold and Silver were on day 7 and reversed lower. I did not go short yet and mentioned that the reason I didn’t go short yet is because we can still bounce and even peak on day 10, 11, 12 or around there, and still put in a left translated daily. Look at the drop & bounce in April ( Blue Box). I drew a possible bounce similar to April's bounce for Silver, but I might go short after watching things play out.
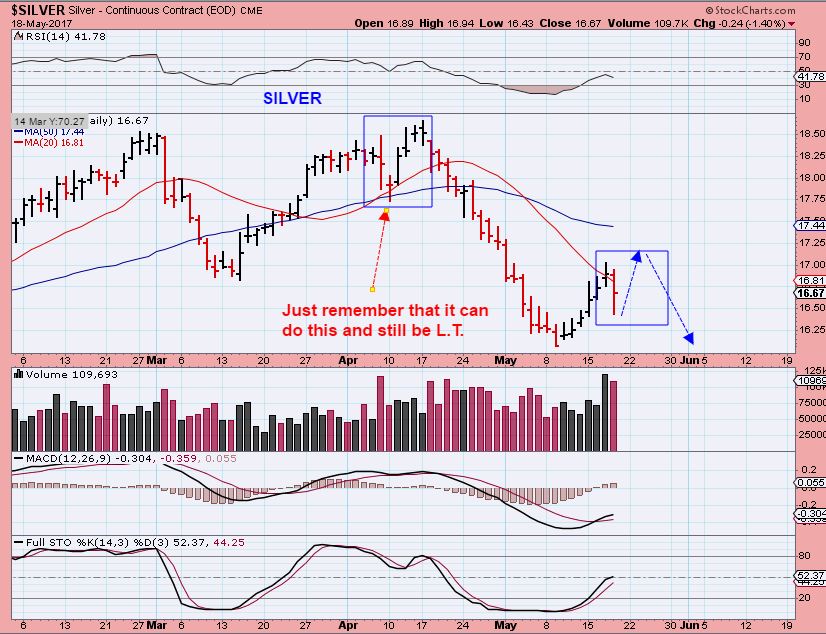
So Silver did reverse on Friday as I expected.I wanted to see what happens Sunday night and Monday before I go short. I’ll discuss my plan to possibly short when discussing the Miners.
GOLD – Gold is now at resistance, but it can still slide higher along that magenta line. Eventually a move higher by the USD could drop Gold. (Though the inverse relationship is not exactly in tact, it could reemerge). I expect a drop in Gold soon.
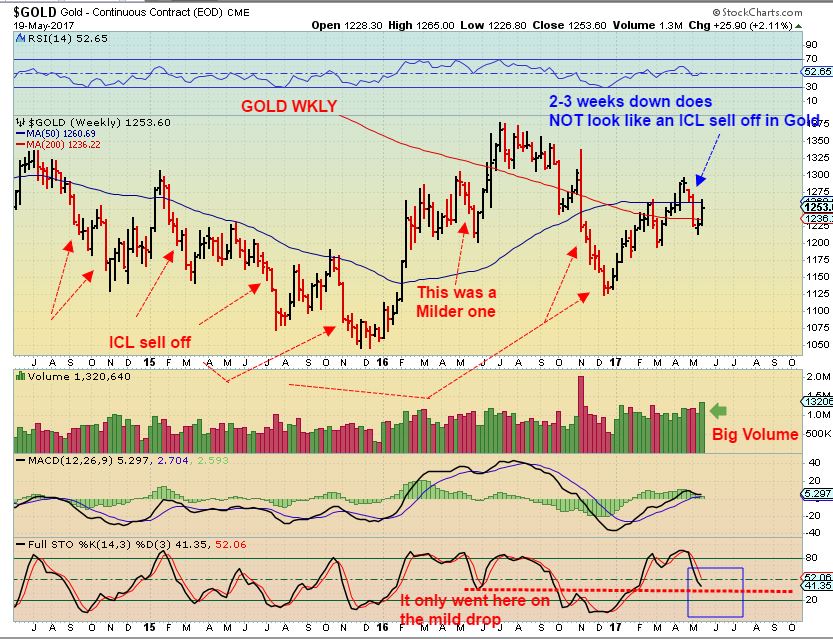
Some have asked if that was an ICL in May. This weekly chart does not stand out as an ICL like almost all of the other ICLs shown. Only the MAY 2016 ICL was slightly similar, but it had 4 weeks of red candles, we just saw 2 weeks. Gold is now at resistance on the weekly chart too. The big volume last week does look bullish, but we’ll see if there is follow through.
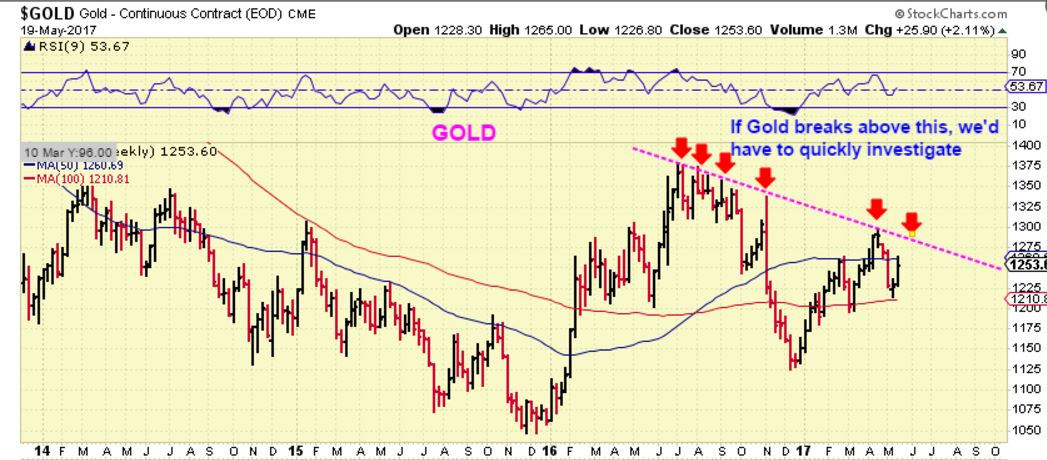
GOLD's BASIC CHART –$1285 max?
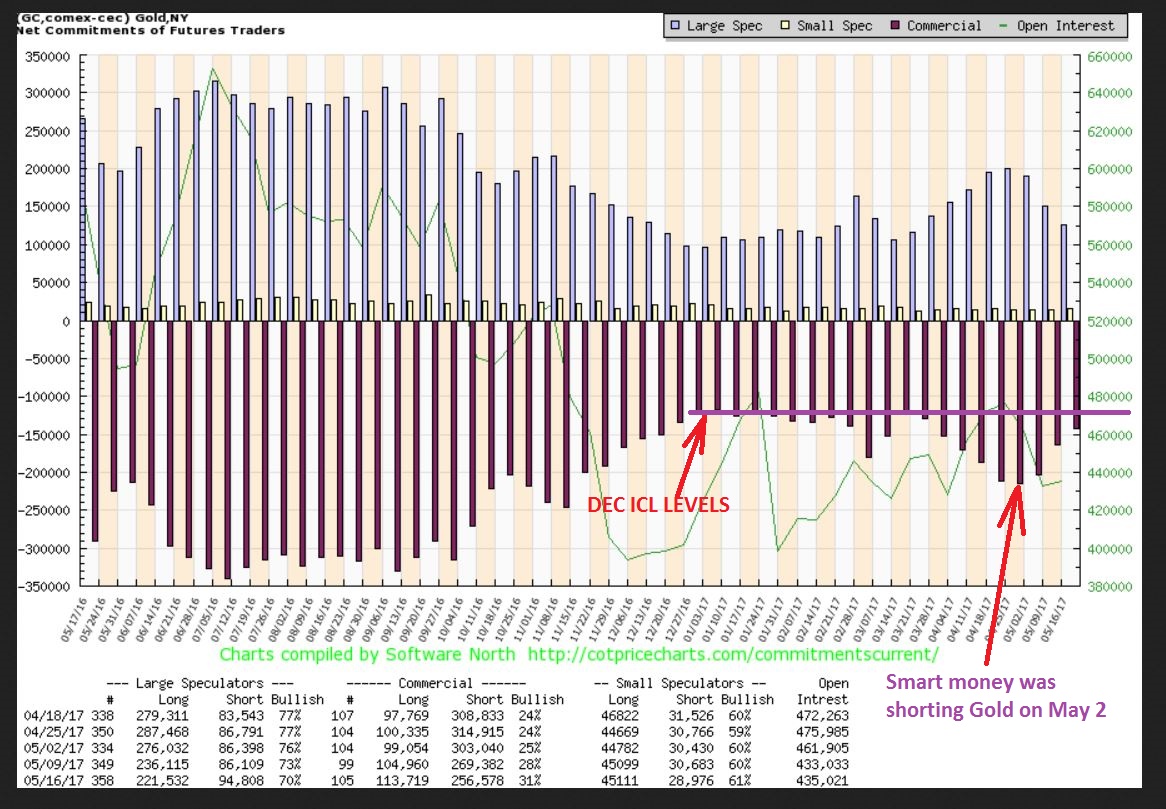
GOLDS COT is getting bullish again, but is not at Dec ICL levels yet.
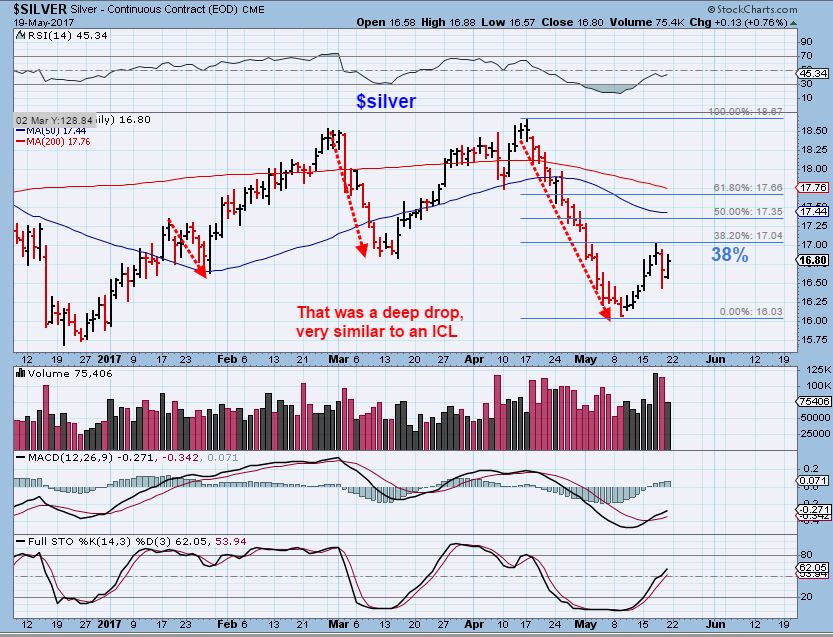
SILVER – Amazing how the bounce stopped right to the 38% fib number. It ‘could’ tag the 50% & 50sma at $17.35ish, but I wasn’t really expecting it to get there.
SILVER –Honestly, this long relentless selloff did look more like a drop into an ICL for Silver, but since Gold held up very well while Silver crashed down, I still expect Gold to drop into an ICL.
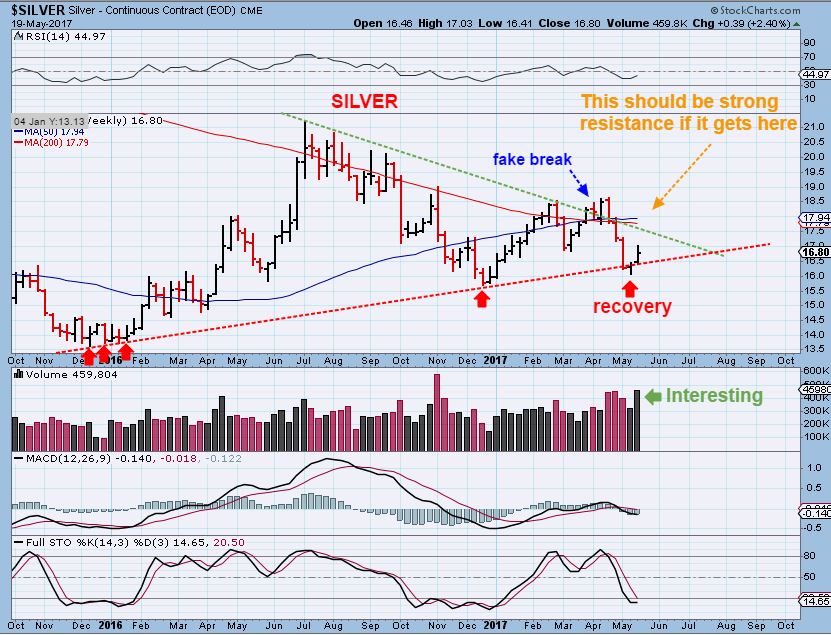
SILVER WEEKLY – Silver also looks like a shake out / recovery on a weekly chart. A spike in volume makes this bullish looking too. Occasionally I get mixed analyses as things play out like this and it leaves me patient and watching for follow through one way or the other. Basically Silver looks like it crashed to a low, Gold does not.
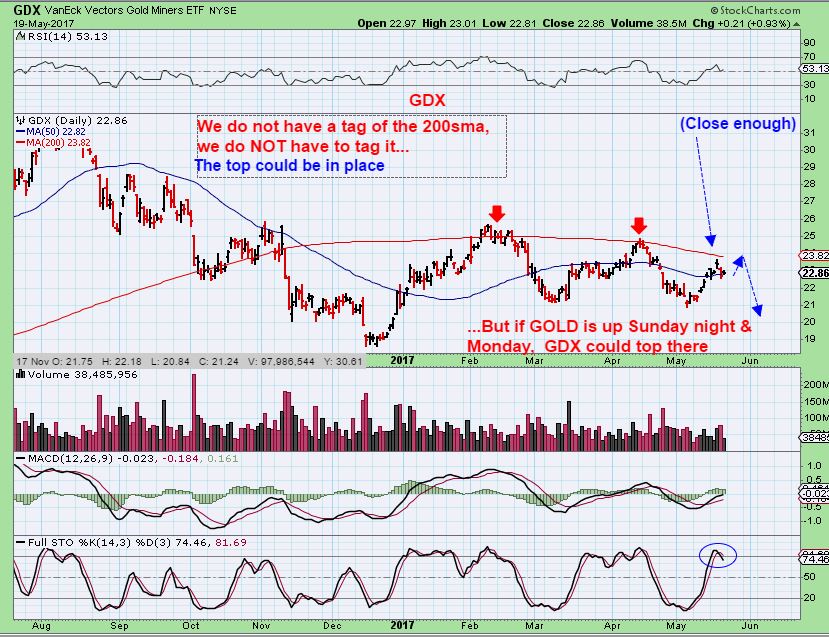
GDX – Read the chart. Miners had two steep sell offs, one in February and one in April. I played the DCL bounce and am out of Miners now both long or short. I need time to watch things unfold, but I have to expect that unless GDX bursts through the 200sma, this is resistance and will roll over into another selloff like the last few tags( ICL, possibly around the next Fed Meeting).
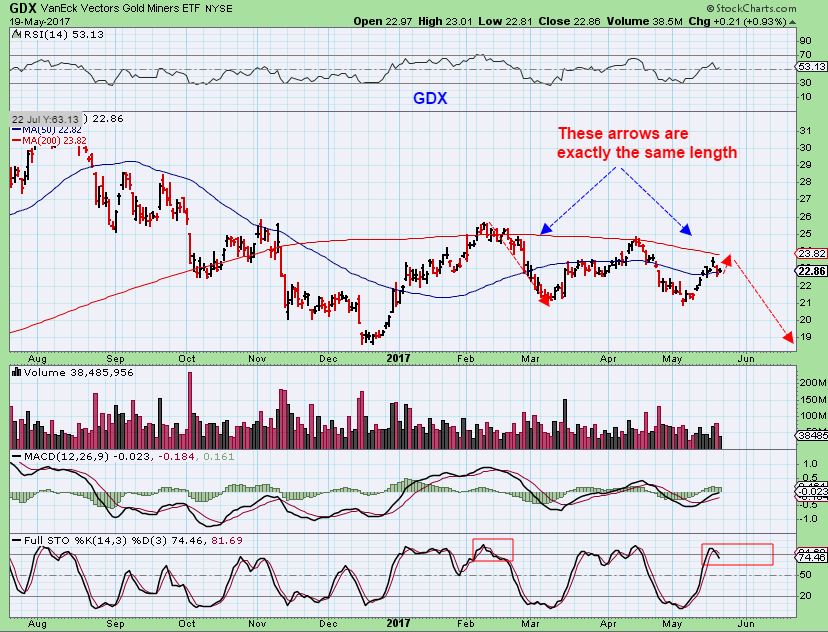
GDX –I drew in a sell off using the same length arrow as the Feb drop and it takes us to Dec lows. Miners are now already slightly overbought here. GDX may tag the 200sma and I may try to short that. Note: A strong break out above that 200sma is unexpected, but we have to say that if it happened, it would be a change in observation. Above that 200sma is where ‘shorts’ have stops, however a small break above the 200sma, like in February, is normal.
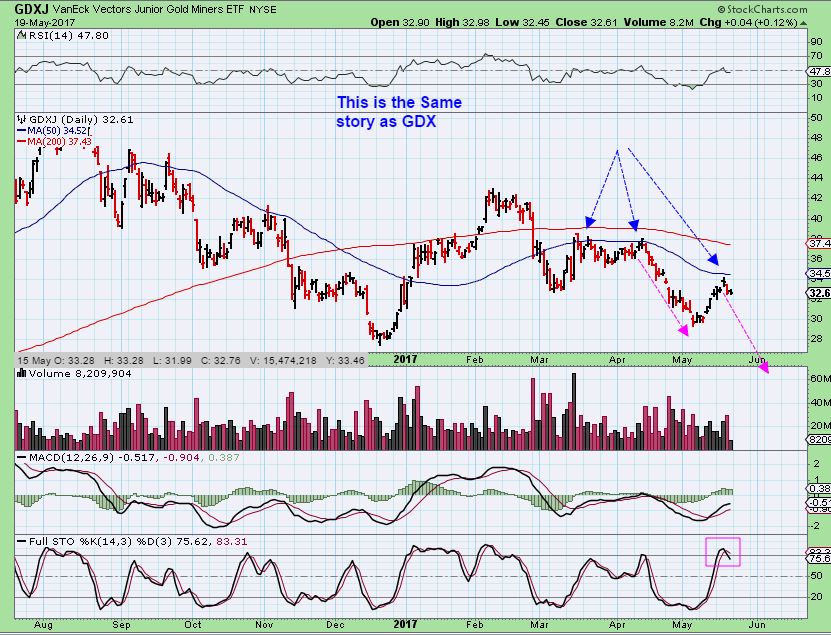
GDXJ –Same story here with the 50sma acting as resistance.The top of this daily cycle could be in, or a bounce & tag and drop.
So this is our weekend review with a few extra observations and some of the things that are in the back of my mind. There is still room to the upside in Precious Metals, as shown, but if the drop into an ICL is ahead, it is very limited and I may go short this week. I will add a few other charts that I found interesting at the end of this report. Monday I will have about 10 trade ideas and low risk set ups to consider.
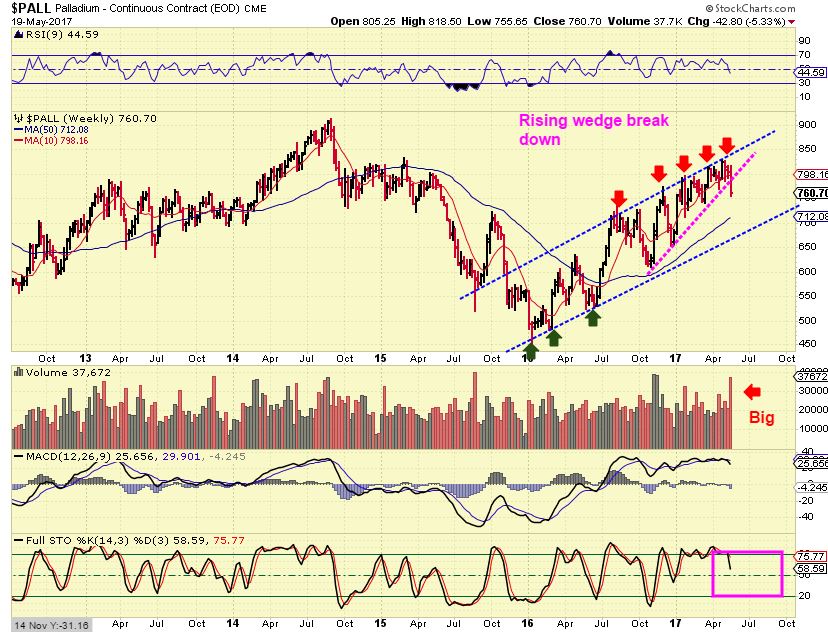
PALLADIUM – This looks like a rising wedge that is breaking down. So we expect Gold to sell off, and Palladium looks like it started to also. That’s good.
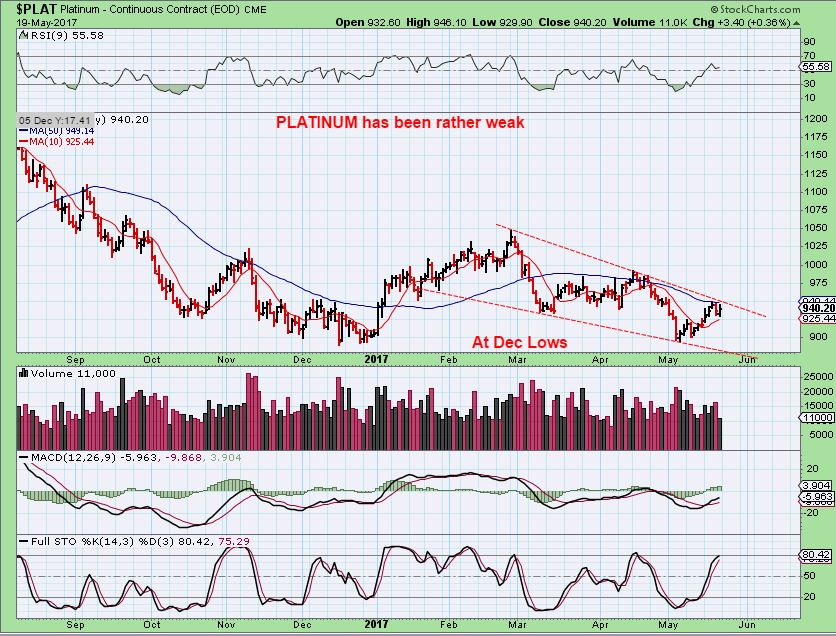
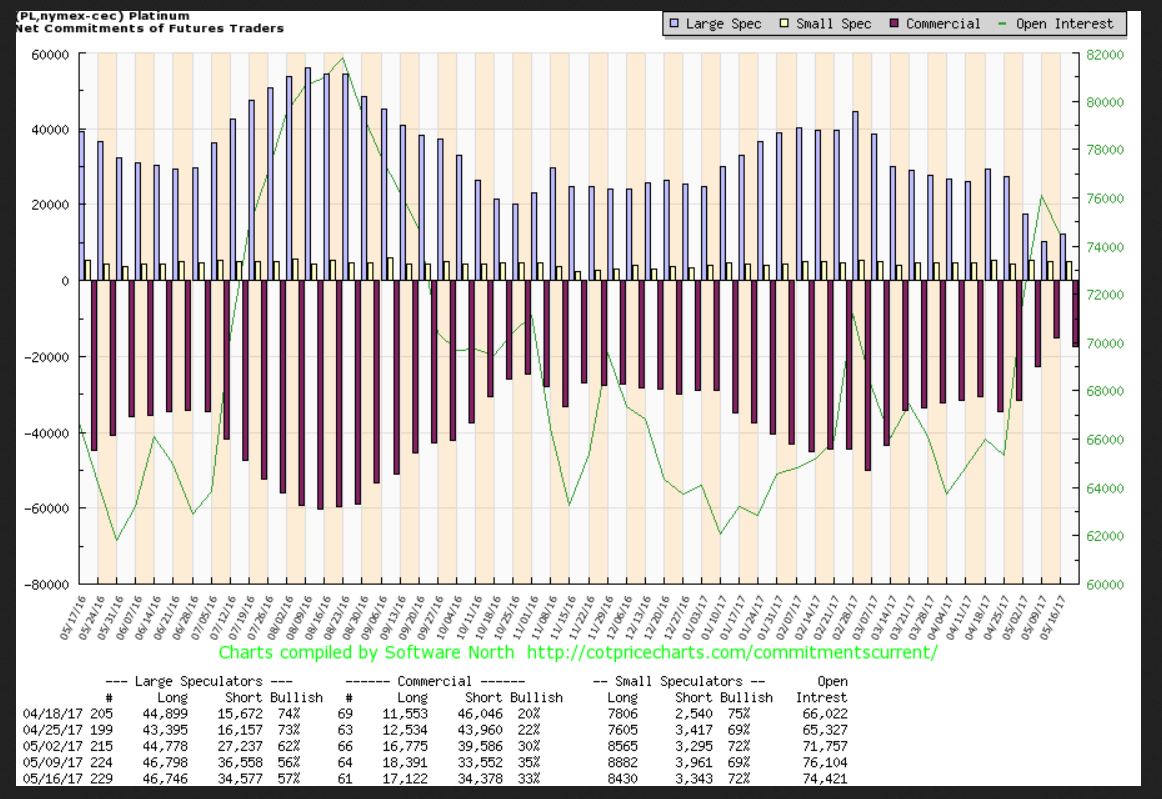
PLATINUM caught my eye.
PLATINUM CHART #1 –Somewhat related to GOLD & SILVER. Does it want to drop or break out here? A final drop would match what I expect for Gold.
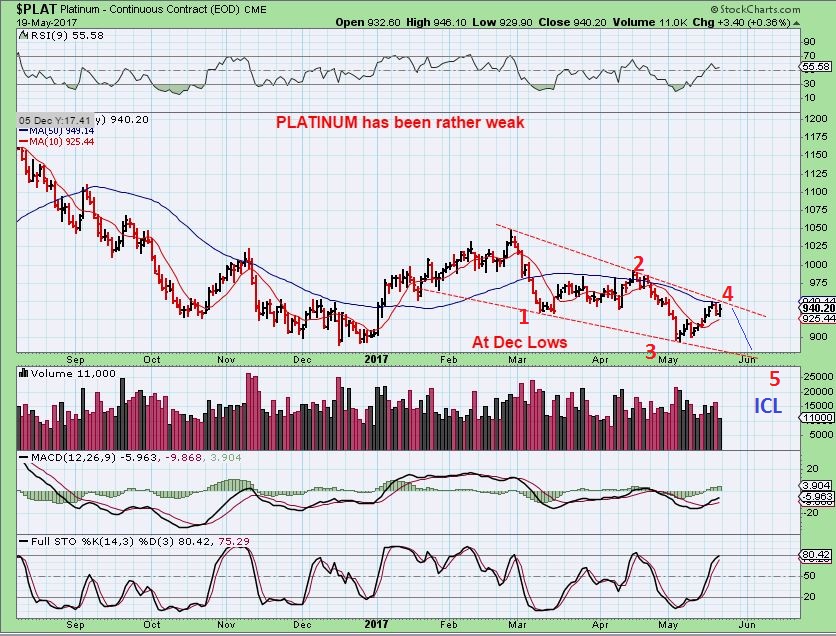
PLATINUM CHART #2 –I could see PLATINUM drop into an ILC with a 1-2-3-4-5 wave move. This matches a final sell off in Gold, However…
Platinum COT looks quite bullish – Smart money is barley shorting Platinum at this point, open interest has run higher. If I am seeing this correctly, Smart money is now less short Platinum than it has been for many years. Think about that, that could be very important. The relationship between Platinum and Gold is an interesting story in recent years. I remember (and most woman that buy jewelry would too) that Platinum used to be MUCH more expensive than Gold. Platinum is now $940 and the smart money has withdrawn their shorts. Hmm? Imagine if it plays catch up?
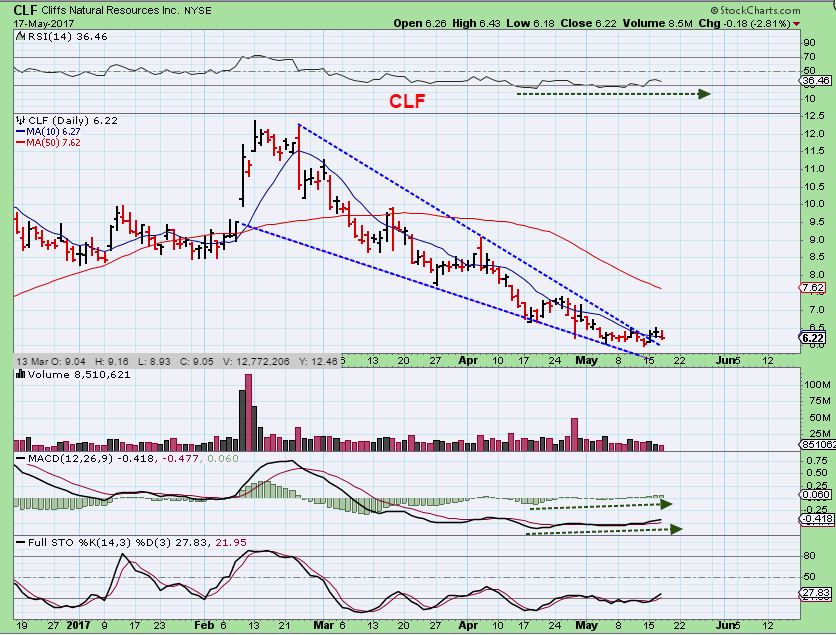
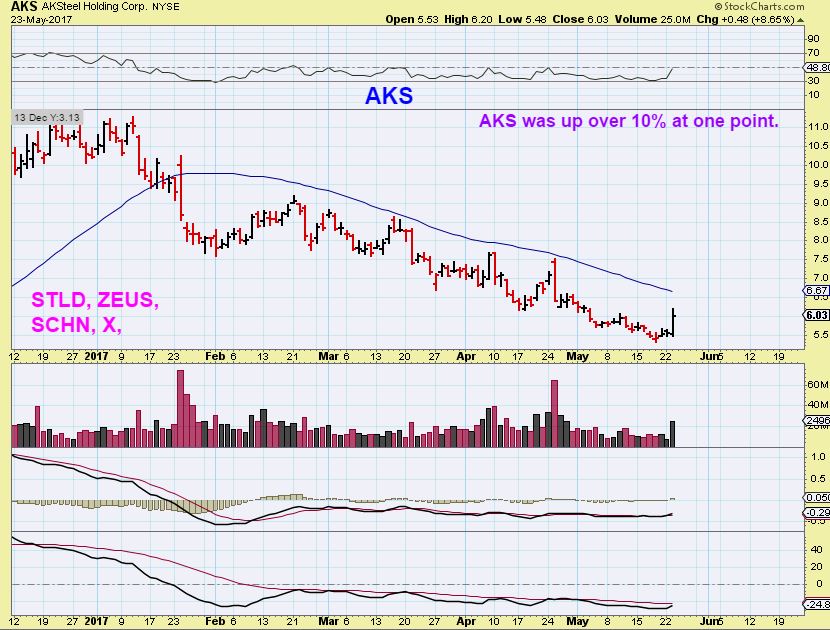
From Monday's report we had CLF & AKS to name a few trade ideas. They were actually mentioned in Friday's report, so this was an update of progress.
CLF MAY 17th – Coming off of the lows and breaking from a descending wedge.
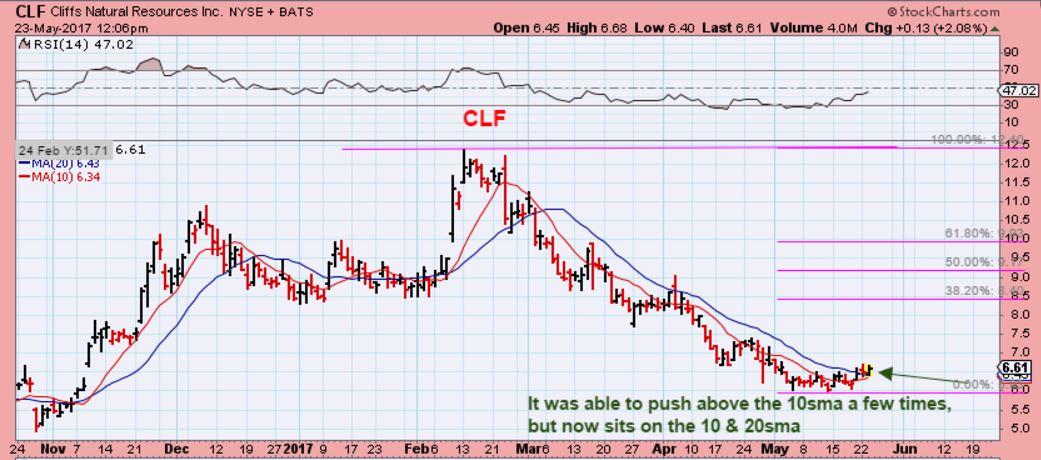
CLF MAY 23 – Now even regaining the 20sma for the first time in a while, a run to the 50sma would be a nice %-Trade.
AKS- At the lows of $5.47. Maybe a run to the 50sma near $6.80.A good % trade.
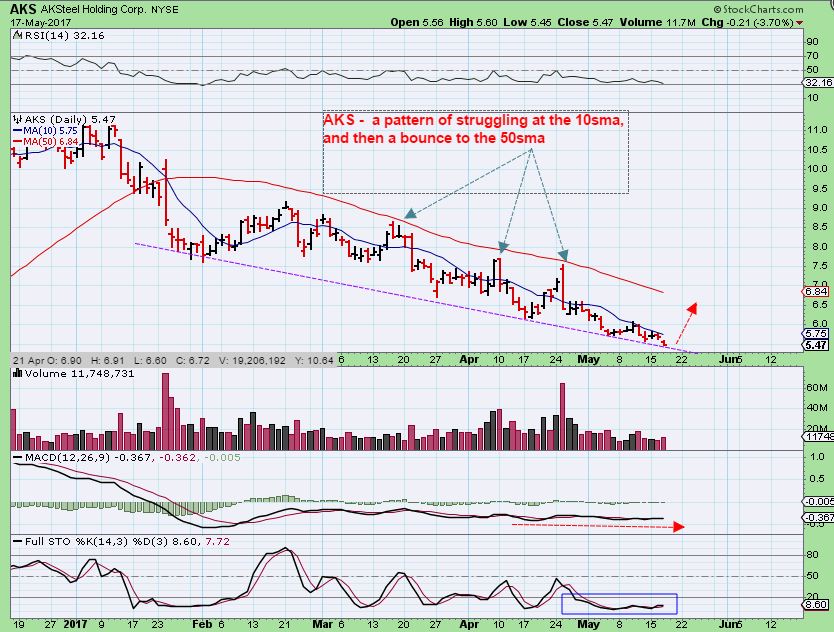
AKS –a 10% pop on Tuesday.
If you think that this type of technical analysis, cycle timing, and reporting could help you with your investing, why not ...
more

