
SPX, Gold, And G6 Mid-Week Target Update
In this mid-week update, we’ll focus on the instruments which already hit their weekly targets. As mentioned before, you can follow the weekly targets and updates here live 24/7. You can also use the TradingView platform to send messages or set alerts.
The weekend target forecast for the SPX focused on two things: that the bullish reaction to the G20 will propel the SPX to 2800, and that any upside from there will be limited due to overbought market breadth. Both events came to pass. Furthermore, on Tuesday we updated our hourly chart and noted that a drop below 2767 will result in a retest of the Monday rally:
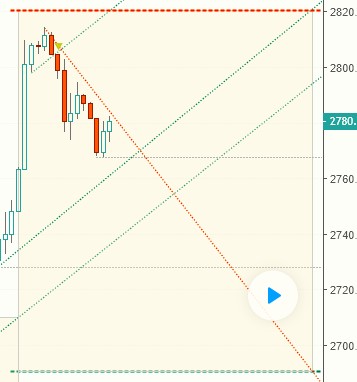
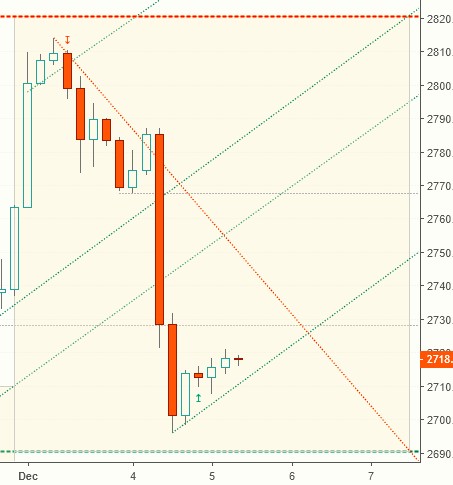
You can click on the arrow in the link and see what happened afterwards. The bottom line is that the SPX dropped precipitously and came to within 6 points of the weekly downside target. The updated 4h chart suggests being long above the green trend-line:
As a side note, if you follow the investment industry you are probably aware that the focus is on hiring quants. What they do is a mystery, but in the end, they all follow the same models and strategies and, since herd mentality is alive and well in quant world, they all tend to buy and sell at the same time. As it turns out, one of their super quant formulas is centered on crossing the 200-day moving average, which in geek speak translates to “deleveraging massive notional in long US Equities expressions across SPX, RTY, and NDX live.” With that in mind, there’s no reason why anybody with a modicum of technical analysis experience can’t run circles around them.
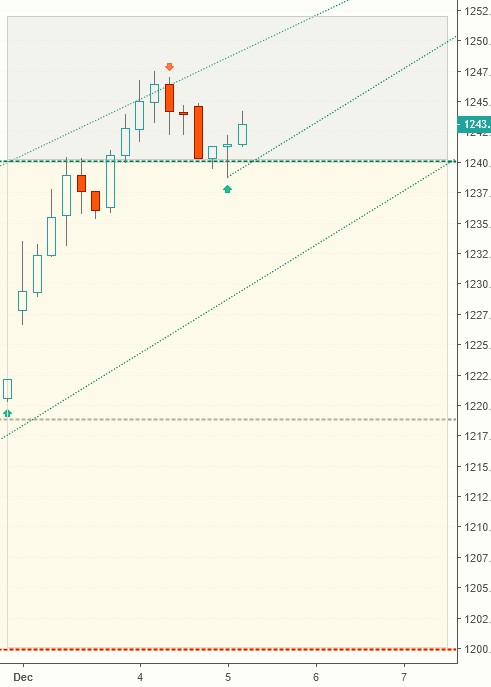
Gold tested the upside weekly target several times on Monday and Tuesday and currently trades above it. This changed the weekly signal to Buy. The new upside target is 1252:
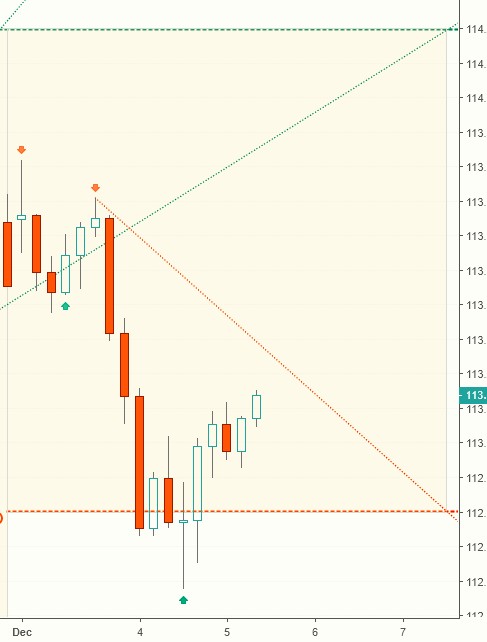
USD/JPY broke below the bullish target angle and dropped to the weekly downside target, which currently acts as support. Looking at the longer-term chart, USD/JPY is consolidating between 111.5 and 114.5 with good swing trading opportunities in between:
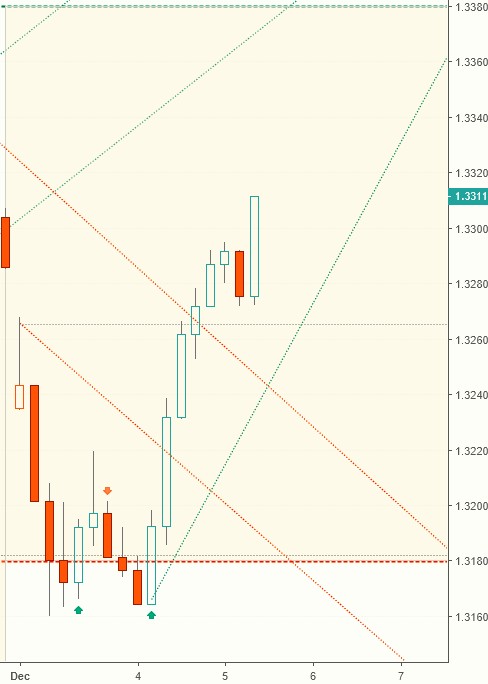
GBP/USD started the week on a Sell signal and reached our downside target on Tuesday. The subsequent counter-trend move fizzled very shortly thereafter, and the daily and weekly bearish outlook remains unchanged:
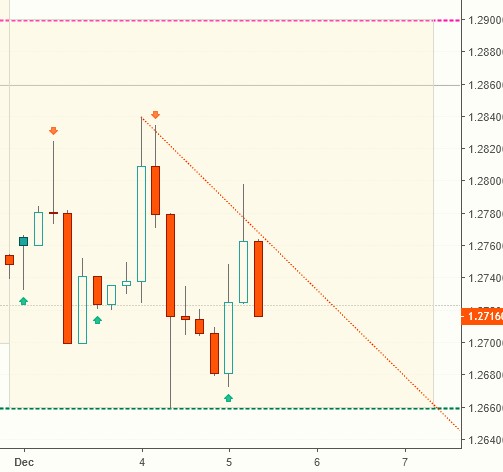
USD/CAD dropped below the weekly sell pivot on Monday, tested the downside weekly target twice, and staged a vigorous rally which reinstated the daily buy signal. The weekly Sell pivot moved to 1.32656:
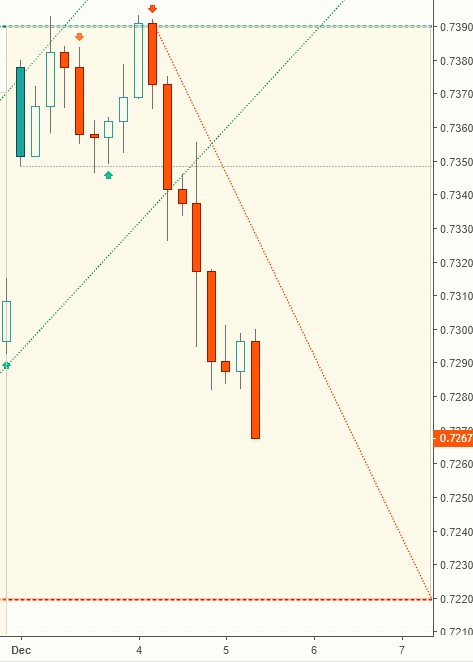
AUD/USD started the week on a Buy signal and tested the upside weekly target twice before the sell-off started on Tuesday. The lower weekly target remains unchanged.
Weekly Buy pivot at 0.735:
*Please note that the trading signals are in effect as of the day they are posted and may change as soon as the markets re-open. When the current signal is hold, we may also include the preceding buy or sell signal (e.g. Buy/Hold or Sell/Hold). Hold signals followed by a buy/sell signal in the direction of the preceding buy/sell signal can be considered for pyramiding the position.
Charts, signals, and data courtesy of OddsTrader, CIT for more


