
Plunger’s Big Trade Update & GDXJ Update
With Rambus at the mercy of a spotty Internet connection I thought I would put out this mini update on Oil and the PM stocks.
GDXJ-
One can see from the below charts that it appears the PM stocks are still early on in the decline process. Of course stocks don’t move in a straight uninterrupted line. Therefore I would suggest we are due for a bit of an upward retracement soon. I claim this on the following basis: RSI is now significantly oversold and is now putting in a positive divergence (note red line). Also stochastics are extended to full range and appear to be in the first stage of turning up. We have reached its measured move as depicted. Also its reached the boundary of its Bollinger Band, (although not outside of it). As a result I covered my short today and actually went long JNUG and some selective shares. I am looking for no more than a bounce up. It may look like a BT to the red bear flags Rambus has drawn in the below charts. I am not advocating others do the same just discussing trading opportunities.
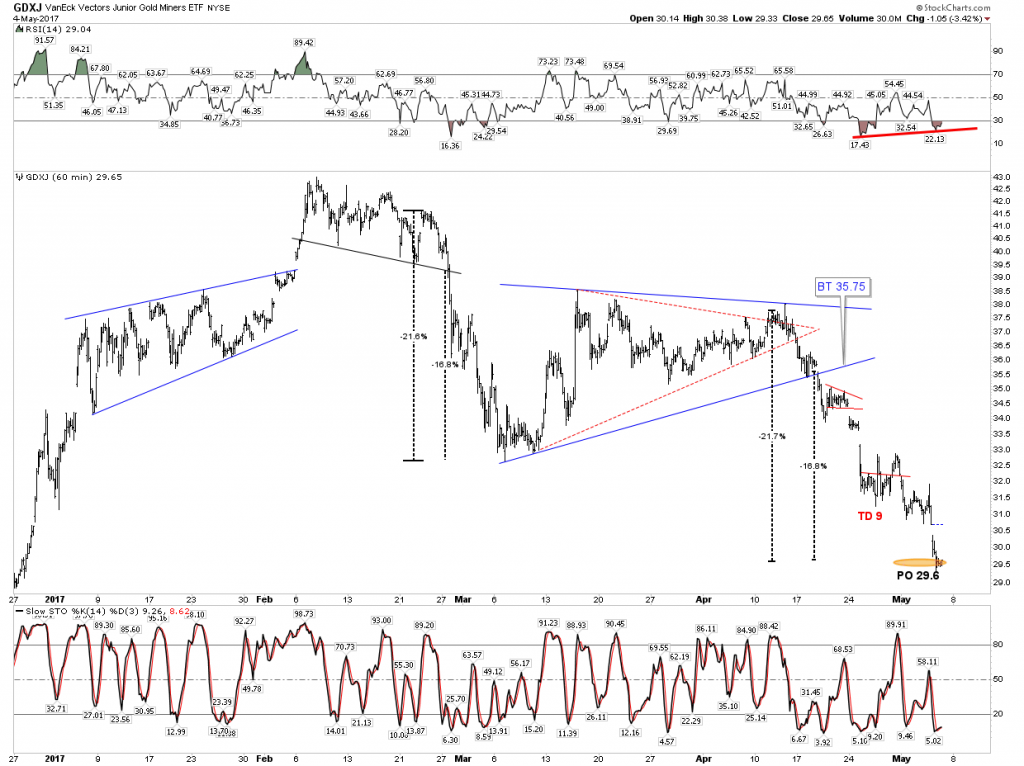
I emphasize I still see the bear in charge of this sector. At best we get a little bounce here. I acknowledge taking a long position here may be a fools errand, I hope not, but it can be called high risk speculation.
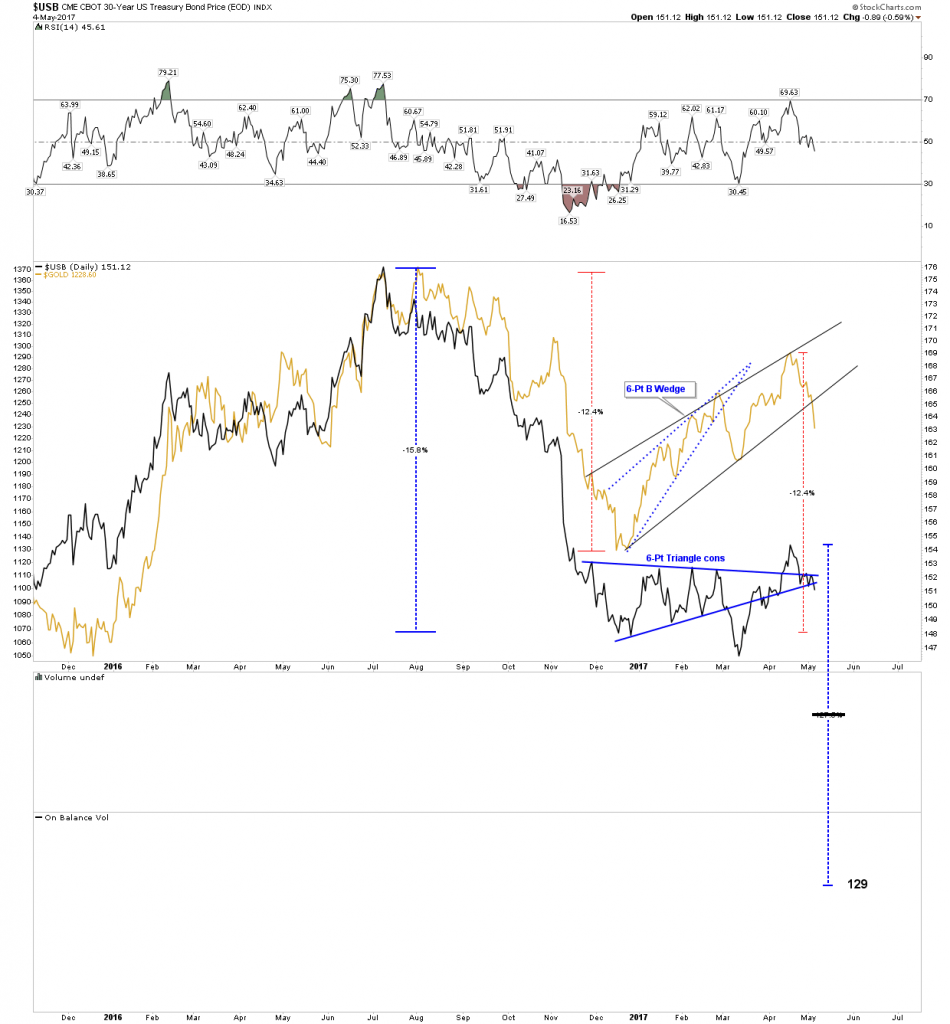
As a reminder, recall I posted the What if question in the weekend report. What if gold was in for a major decline? Where bonds broke down and took gold with it? Recall the measured move for this scenario shows gold just above $1,000 if this were to occur. Well today we received a little clue that we need to pay attention at least to this scenario. The chart below shows a break of two patterns for gold and bonds. I am just bringing it to your attention.
Plungers Big Trade-Update.
I hope my analysis of this trade was cogent enough for you to have seen it and you took a position. Its been a barn burner right from the start. Today I took a couple of chips off the table. I sold my DWT. I have retained my option spreads and short UWT positions which is the bulk of the trade, but I just felt its time to give some of it a rest.
Maybe it was the news that Dennis Gartman made a call to short oil. That’s usually a pretty good contrary indicator. If we get a bounce at some point I am going to ride through it with my existing positions as they decay in my favor with time.
Again, this has been a great trade with some of the option spreads delivering over 100% gains in just 2 weeks. DWT is a vehicle that trades with plenty of liquidity and narrow spreads and as of today we have booked a 59% gain in two weeks. This is a great start, but I see much bigger gains ahead, but the trade has to be managed. Selling my position in DWT is me managing my trade.
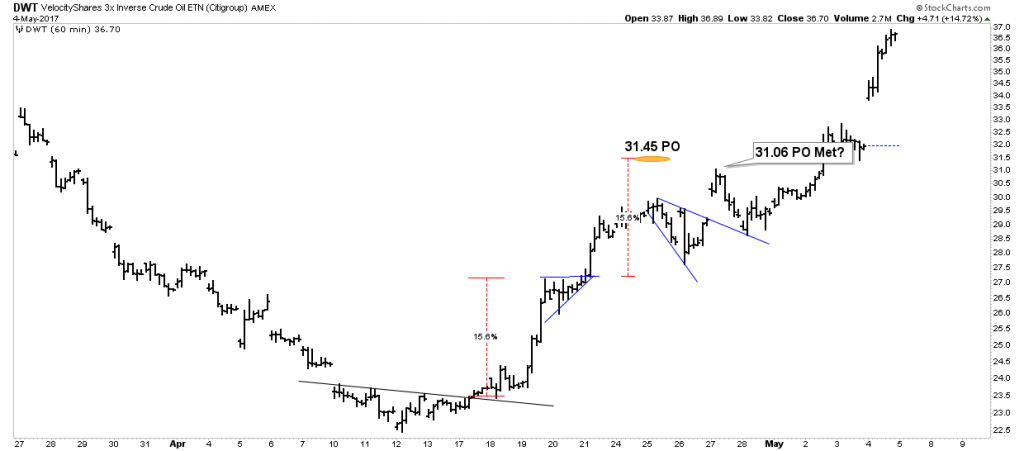
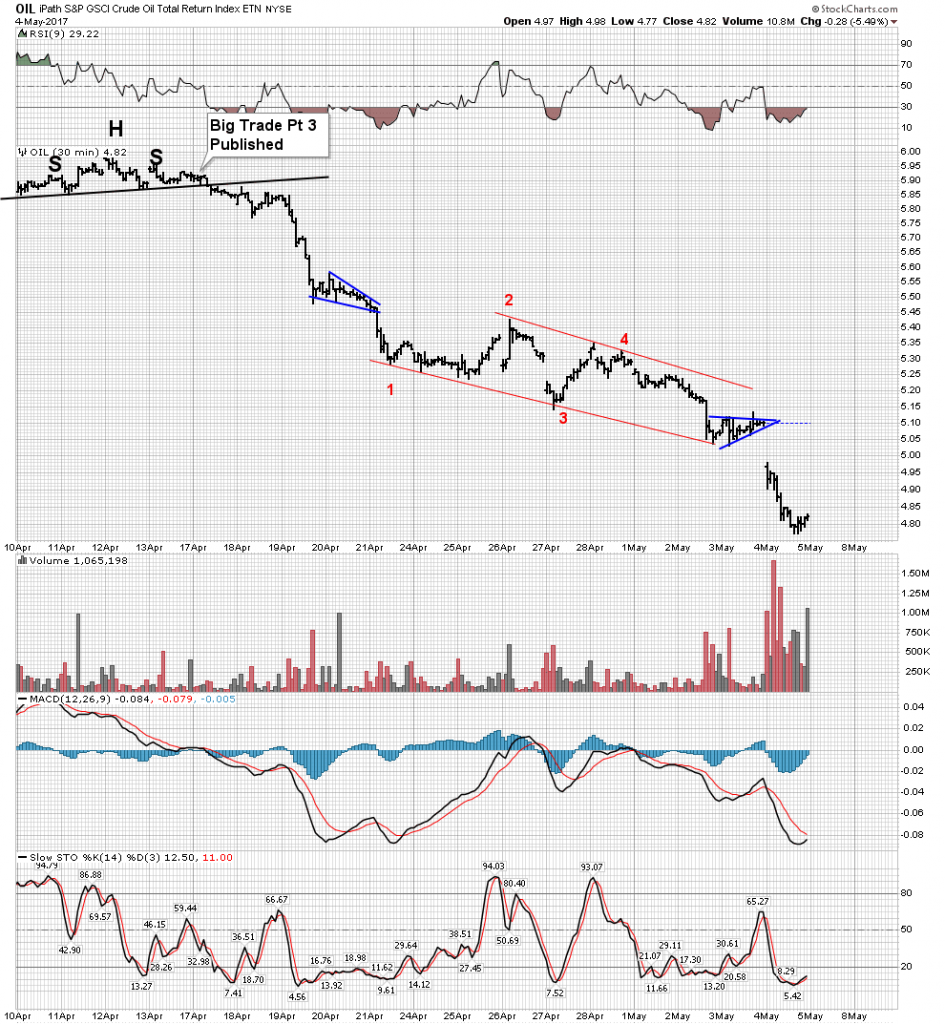
Here is the action coming off that original break of its channel back in early march. Keep in mind we have caught this one going both ways capturing both legs down, the first one and the second after the back test. I wasn’t agile enough to catch the run back up.
Here is a close-up of it coming out of that BT H&S. It is getting a bit over extended.
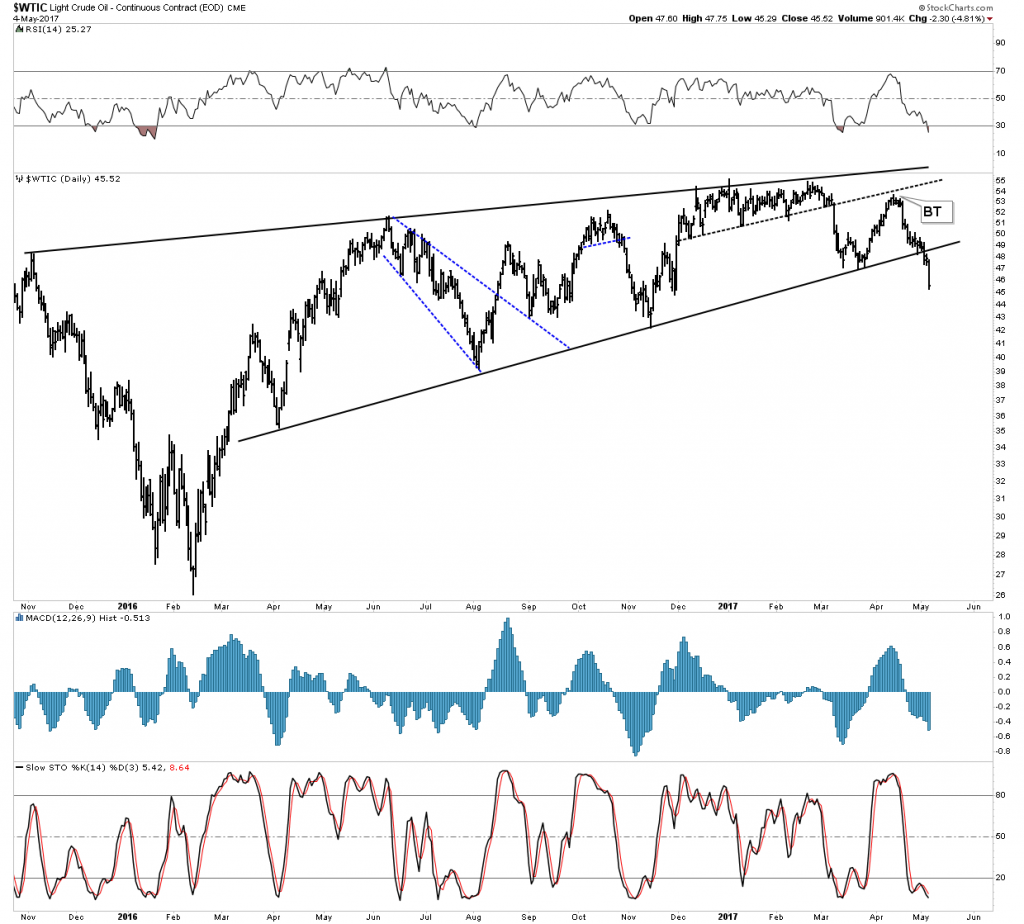
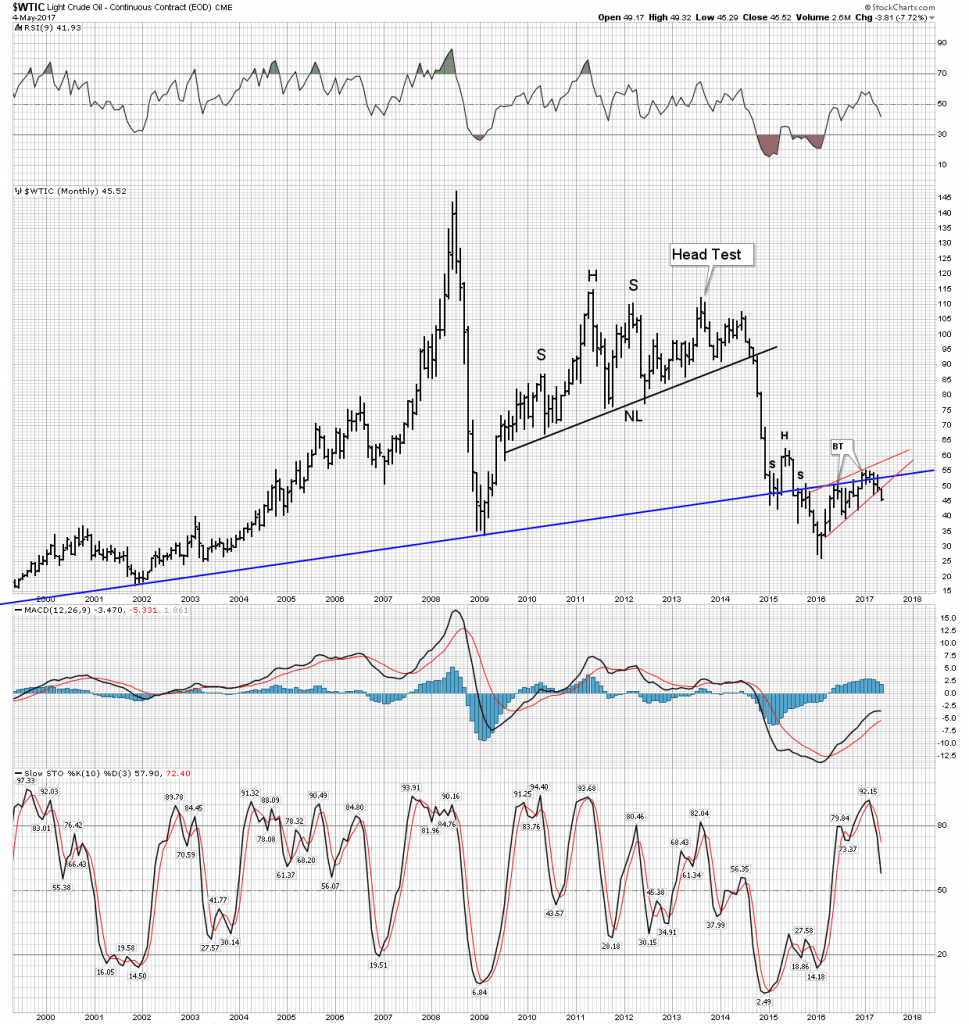
So here is the bigger picture of the entire move. The thesis is that we are going to retrace this entire move or at least a major part of it for two reasons. #1 we are still in a secular bear market in oil which started in 2008 and is not over and #2 we are entering a recession and demand will slacken among a sea of new production. But, as I have said it doesn’t go in a straight line. We have now cleanly broken the rising wedge and are now ripe for a BT. It doesn’t have to happen, but I am hedging my bets that it will. Again managing my trade.
Another reason, I am moving some minor chips to safety as today we transited well outside the BB. Plungers rule is not to expect an index to to stay outside of the BB for more than 2 days.
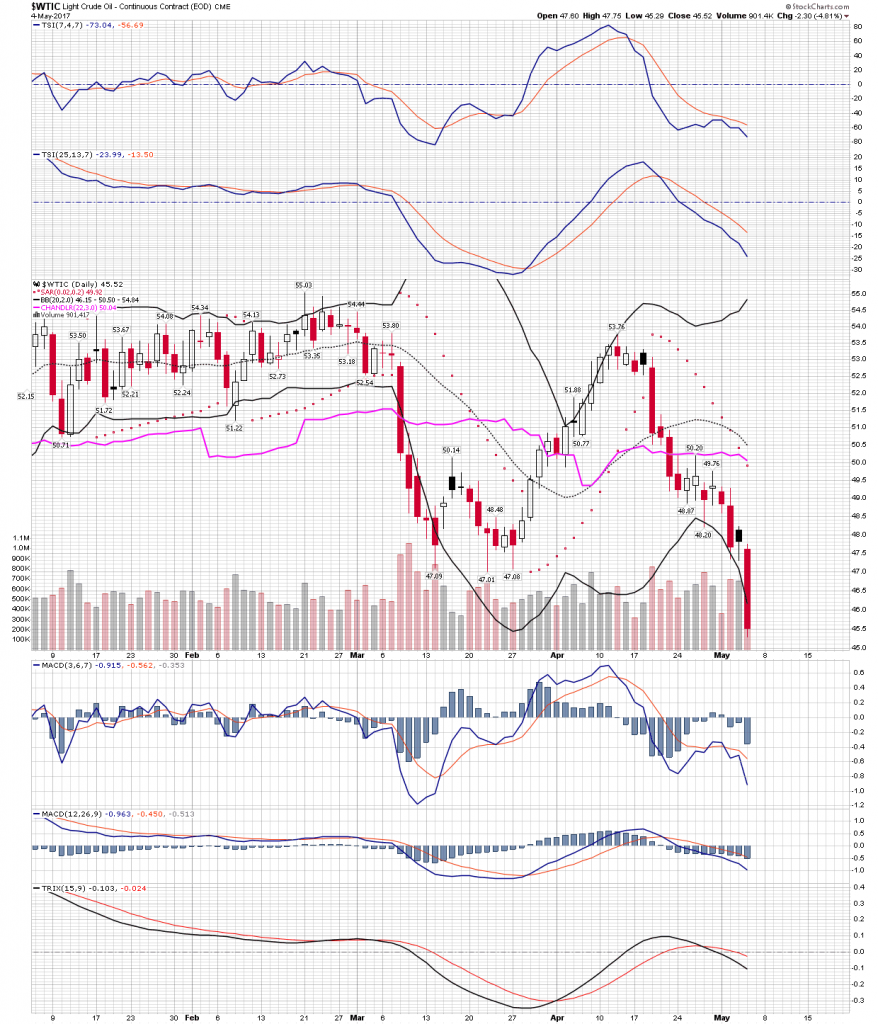
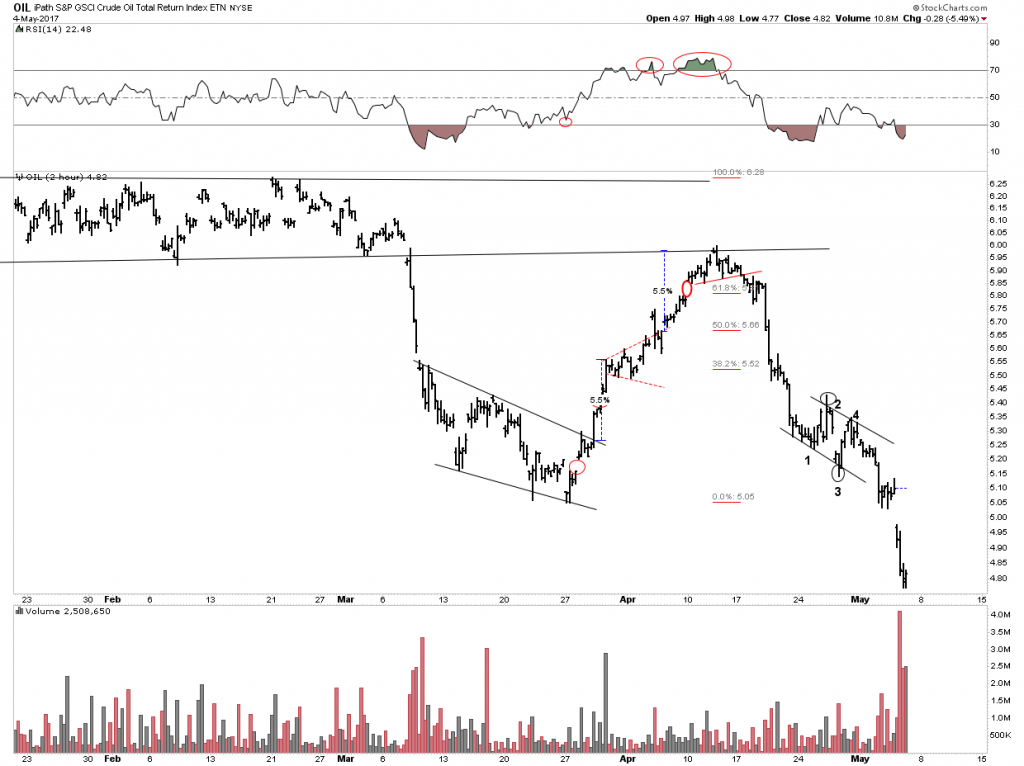
One last look at oil. There can be little doubt what is now occurring, but can we expect a back test?
Let’s move on to Commodities.
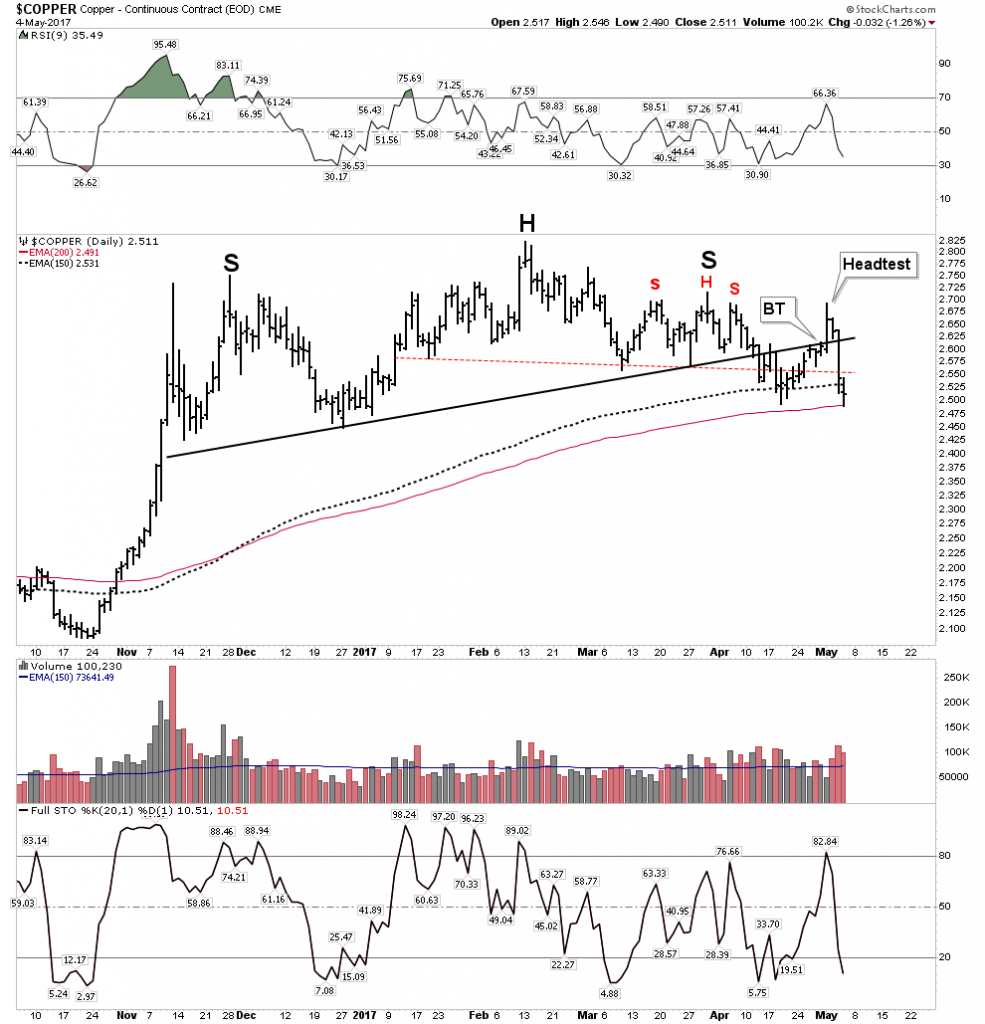
I have been harping on this so much lately, because I believe it is sending a signal to all of us loud and clear and we better be listening. First off copper is now out of the whispering stage. It’s talking loudly. If it breaks the 200 EMA I would consider it in the shouting stage.
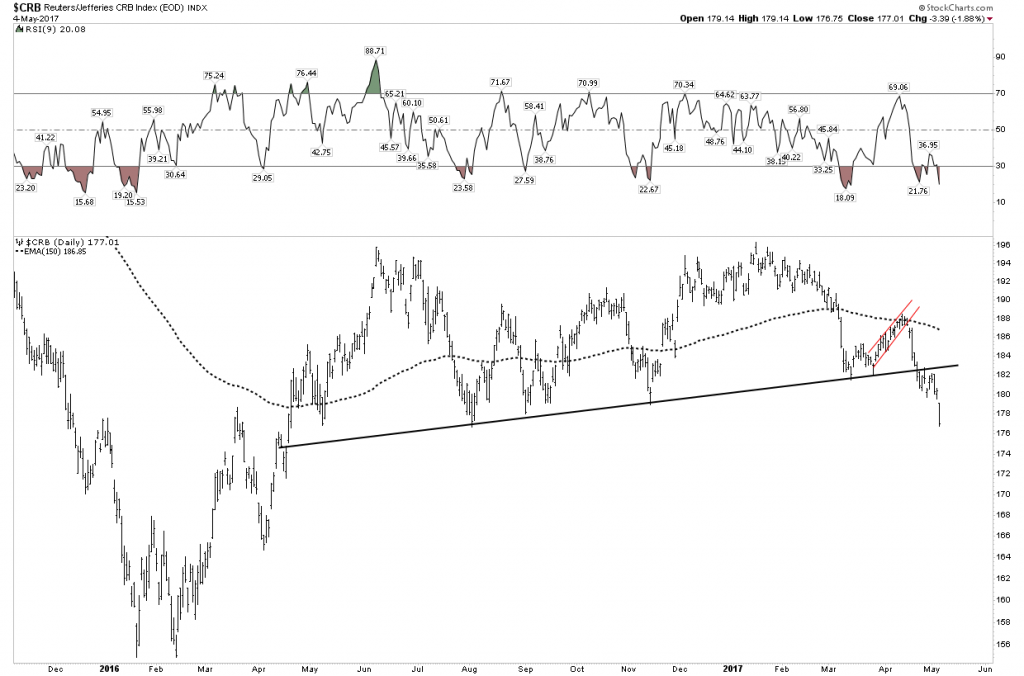
And the CRB. There can be no doubt now this sector is in big trouble.
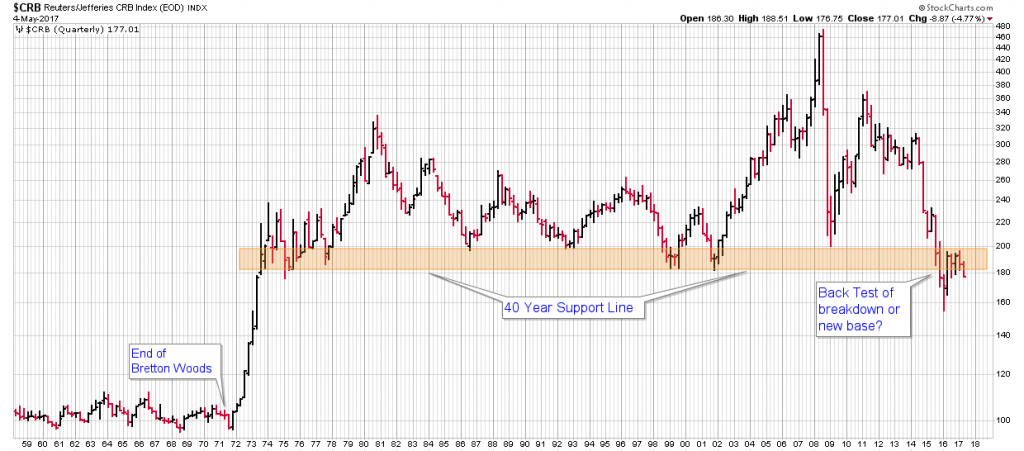
And of course the uber big picture: Knights go sit in a dark room and ponder what this chart is saying to us. Consider the word credit contraction
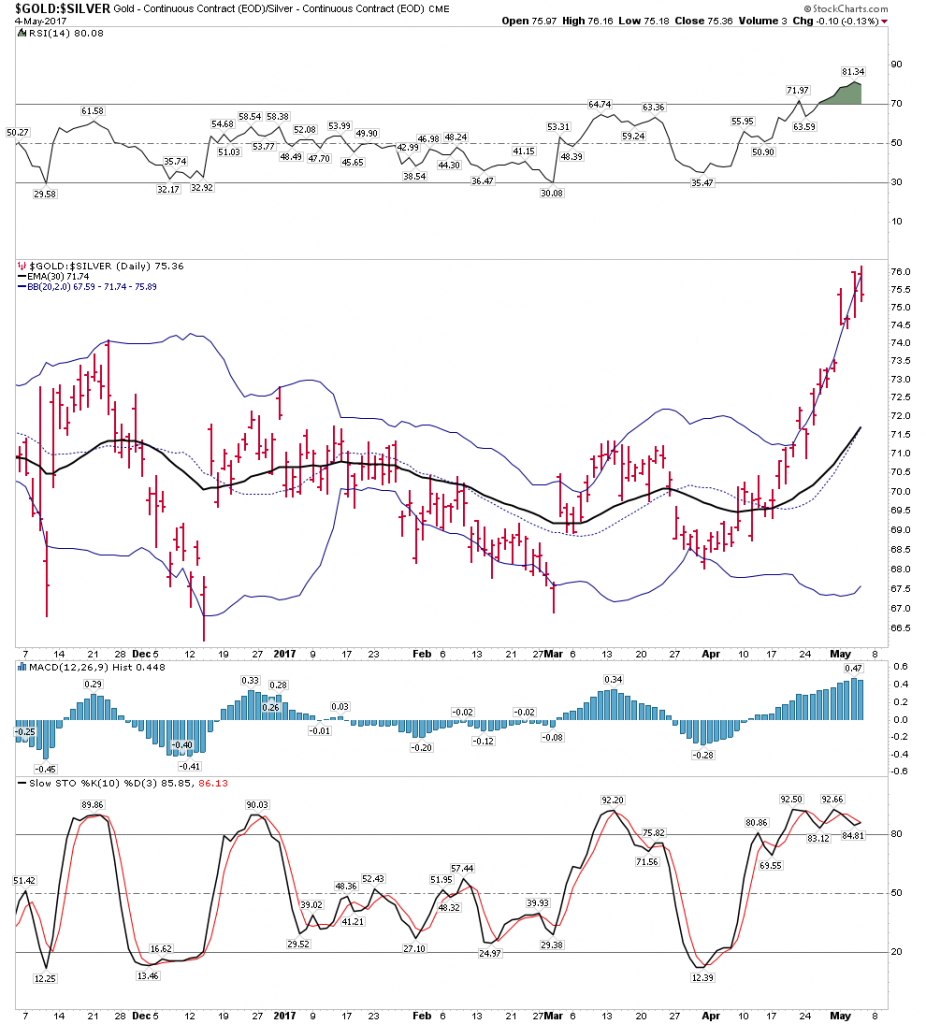
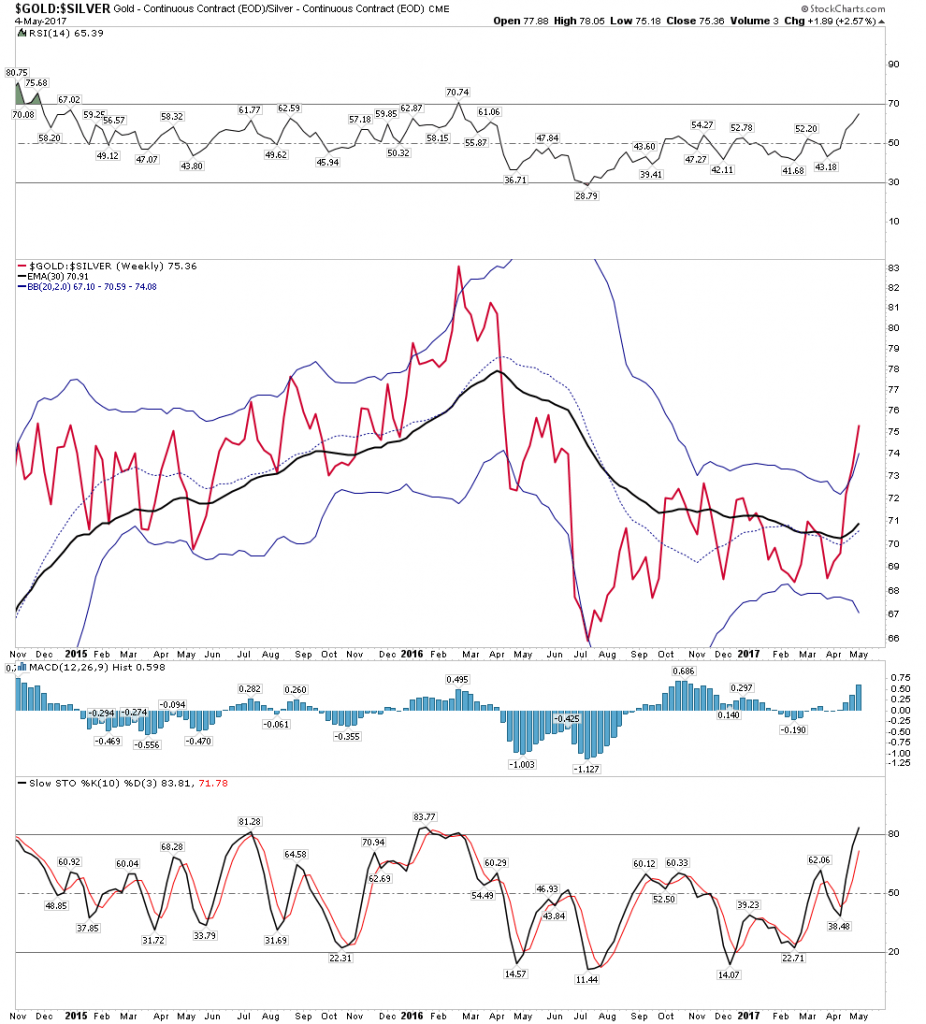
All the above charts I have shown are very distressful. For Big Bears like me they have been a big cash register. But, I sense I may be near the end of my run for now. Take a look at the GSR. We got a downside reversal outside to inside the BB. That tells me panic among the commodity space might need a bit of a rest. Maybe it takes shape in the form of just a BT to those neck lines. That’s why I hedged and took on some of my favorite PM longs.
Daily GSR: (Gold Silver Ratio) When Gold is stronger than Silver it indicates a Credit Contraction
The weekly:
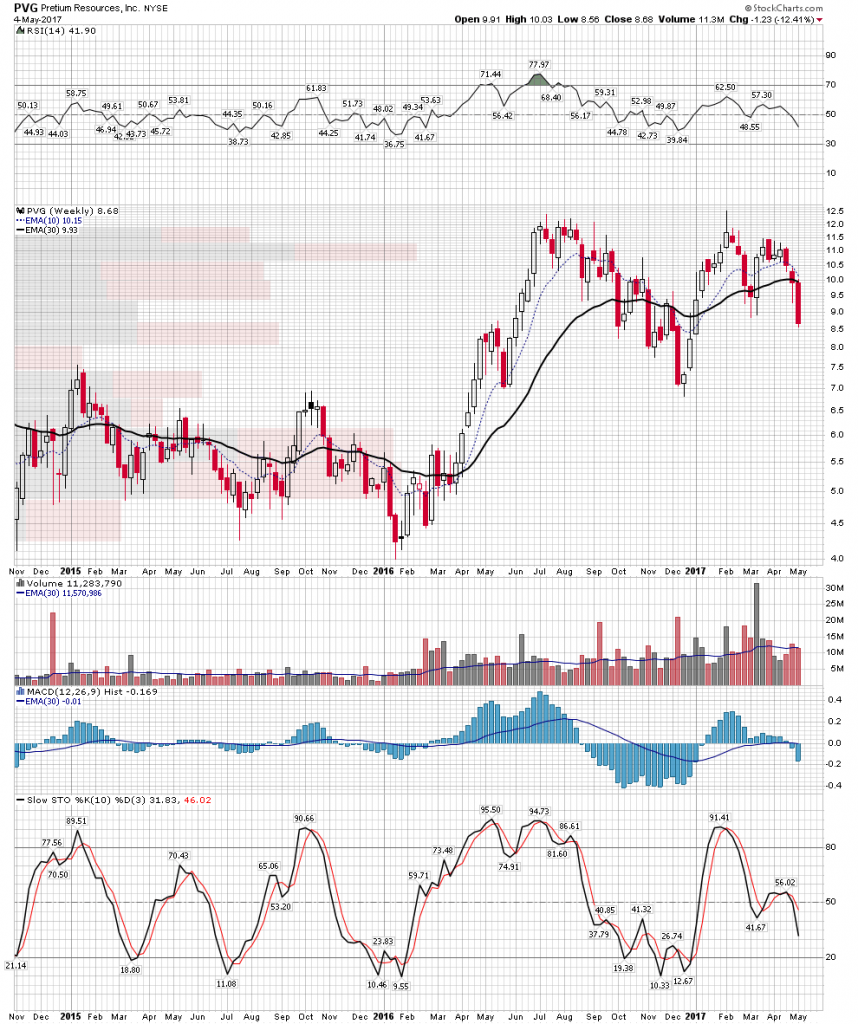
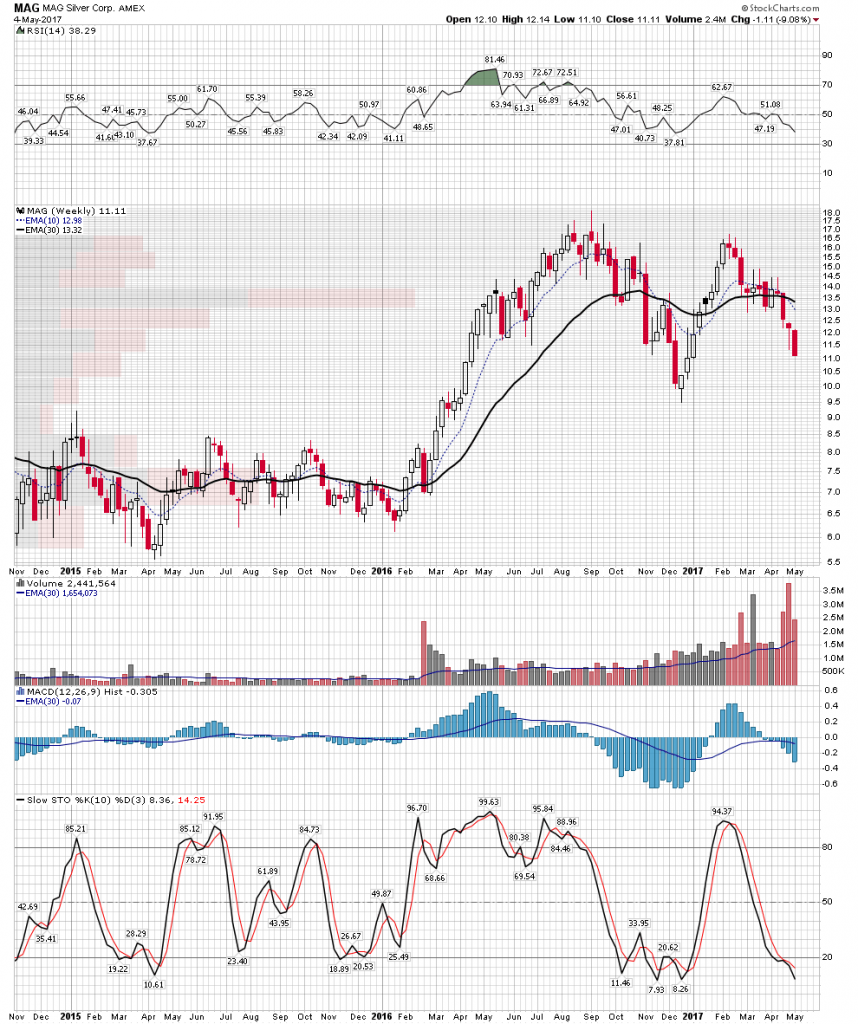
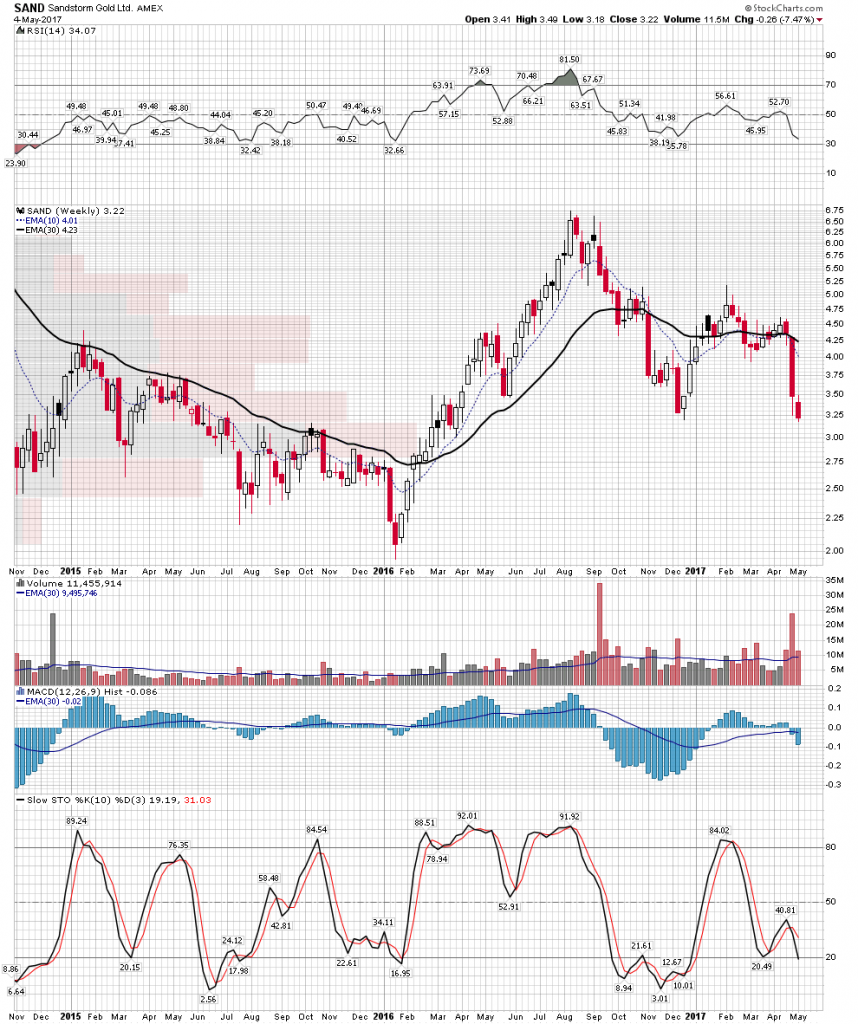
Just for fun here are some of the favorite in my stable bought today, I am not falling in love here and they will be on a tight leash:
Disclosure: Editor’s Note: Plunger has joined Rambus as associate writer at http://rambus1.com/ Now members have access to two dynamic authors.


