K.I.S.S. The Gold Sector
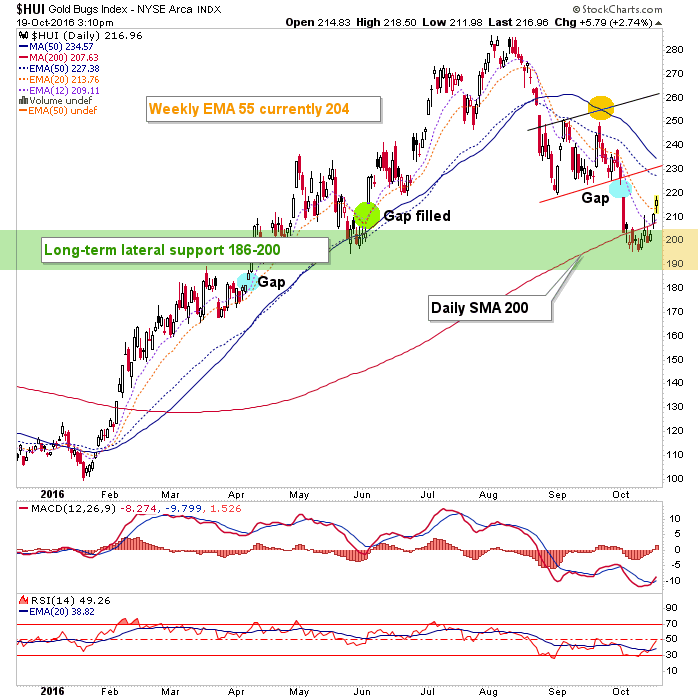
“Keep it simple stupid.” I tell myself that all the time, and as I watch the various TA “top guns” (a term once hilariously coined by Jim Sinclair in reference to some chart guys obsessing on the sector almost exclusively) emerge to guide the beleaguered gold bug out of his bunker I’d like to present a simple daily chart of HUI.
It’s the same one we used to project this bounce (by NFTRH updates) well ahead of time and it’s similar to charts we used to accurately call, play (if desired) and then guard against the last two bounces, in September. Last week HUI became over sold below the SMA 200 at support after filling a gap. It was a logical bounce point. But now some of the mouth breather brigade, which always feels the need to ‘call’ things without seeming to much consider the fallout if wrong, are confident the bottom is in.
My friend Mark (IKN) wrote some nice words about NFTRH the other day and when I emailed to thank him part of his response was that I’ve been really dialed in lately though “maybe a little wussy on gold, but all good”. Yup, that’s me! I consider it my duty not to lead people into harm’s way but at the same time not hold them back from opportunity as well.
To that end, we have identified the bounce in the sector (when it should be ID’d, ahead of time) as just that, a bounce. There is no need to define it as anything else because I am not a pumper and I don’t have a need for readers to identify with me as a gold analyst or anything other than a hard working market manager trying his best to come out the other end with profits realized through sound risk management and opportunity identification.
Last week when we identified a potential bottom, that opportunity was for a bounce. No matter the growing bravado out there, the sector is only on a bounce until it takes out some real upside obstacles, the first of which it is approaching in the 220’s. The convergence of the declining SMA 50 and the broken bear flag line (red) would be next.
From the lows below 200 the risk in the sector was bled out wonderfully. But it is what it is folks, until it defines itself as something other. See? Simple.
Pluses and minuses, per the chart (fundamentals are a whole other animal, which we update every week in the formal report).
Positives:
- Huey is back above the weekly EMA 55, not shown on this chart but a key bull market indicator.
- Huey hit long-term visual support (not shown, but coinciding with the SMA 200).
- A gap resides up in the 220’s, toward 230 that seems to want to fill (minor).
Negatives:
- Heavy visual resistance beginning in the mid 220’s.
- Downturned SMA 50 declining to meet that resistance area.
- Daily downtrend.
Disclosure: Subscribe to more


