
Is 2015 The Year The Fed Comes To The Aid Of Gold And Silver Investors?
In a moment we will provide our answer to this interesting question.
The correction in the price of gold and silver is now in its fourth year, and in the words of W. D. Gann: “When time is up – price will turn.”
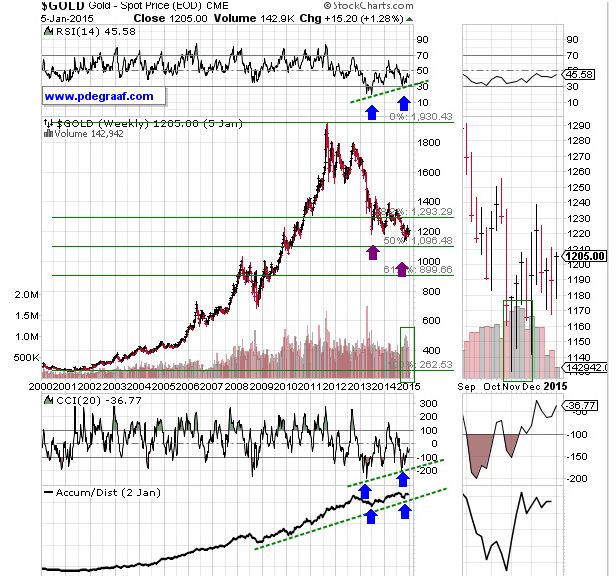
Featured is the weekly gold chart. The current bull market began in 2002 with gold at $260. The correction that started in 2011 has retraced 50% of the rise from $260 to $1930. You will notice that the latest drop to the 50% retracement level has been met with non-confirmation from the supporting indicators (blue arrows). This includes the important A/D line which has been positive from day one. Notice also the buildup in volume during the recent turnaround (green box).
“Which countries contain the most peaceful, the most moral, and the happiest people? Those people are found in the countries where the law least interferes with private affairs; where the government is least felt; where the individual has the greatest scope, and free opinion the greatest influence; where the administrative powers are fewest and simplest; where taxes are lightest and most nearly equal;….where individuals and groups most actively assume their responsibilities and, consequently where the morals of human beings are constantly improving; where trade, assemblies, and associations are the least restricted; where mankind most nearly follows its own natural inclinations; in short, the happiest, most moral, most peaceful people are those who most nearly follow this principle: although mankind is not perfect, still all hope rests upon the free and voluntary actions of persons within the limits of right; law or force is to be used for nothing except the administration of universal justice.” ….. Frederic Bastiat (from his booklet ‘The Law’)
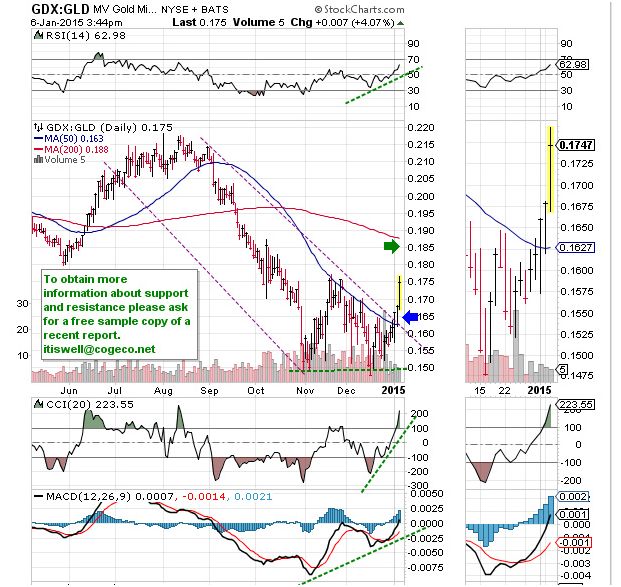
Featured is the index that compares mining stocks (GDX) to gold bullion (GLD). The sure sign of a bull market is when the miners outperform bullion. The breakout at the blue arrow, after price formed a double bottom at 0.15, - a breakout that is confirmed by the supporting indicators, - is very significant. When this index is rising, it provides positive energy for both the mining sector and gold bullion. The breakout target is at the green arrow.
“When plunder becomes a way of life for a group of men in a society, over the course of time they create for themselves a legal system that authorizes it and a moral code that glorifies it." Frederic Bastiat
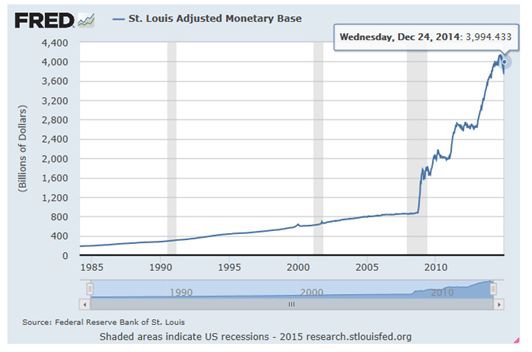
This chart courtesy Federal Reserve Bank of St. Louis. At first glance the chart gives the appearance that the Fed is reducing the Base. On December 10th the money supply had dropped to 3.7 trillion dollars. However by December 24th the Base rose back up to 3.9 trillion (blue dot). This oscillating is likely what is causing weakness in the DOW and S&P early in the New Year. The last two times the Monetary Base stopped rising (notice the sideways action in this chart, which lasted several months); on each occasion the S&P dropped by 15%. The Fed officials are between a rock and a hard place. If they tighten, it will cause the dollar to rise further, and the stock market will drop off a cliff. If they allow the Base to increase, gold and silver will rise sharply. The Fed is unlikely to stand by and watch the dollar rise much further (see next chart).
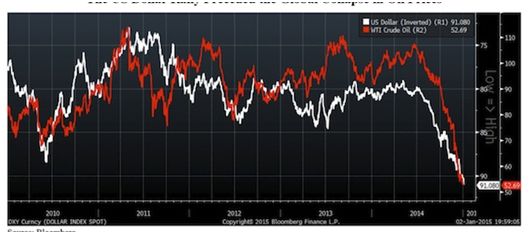
This chart, courtesy John Mauldin’s popular E-letter (Mauldineconomics.com), shows the tight relationship between the US dollar (here inverted), and the price of oil. The low oil price is putting a serious strain on a number of financial institutions, along with many energy producers. The higher the dollar rises, the greater will be the strain. The Fed can (and very likely will) print dollars to end the current rise and thereby allow oil to seek its supply and demand level. The printing press and the resulting currency destruction will provide energy for gold and silver.
“Liberty is the freedom of every person to make full use of his faculties, just as long as he does not harm other persons while doing so.” …..Frederic Bastiat
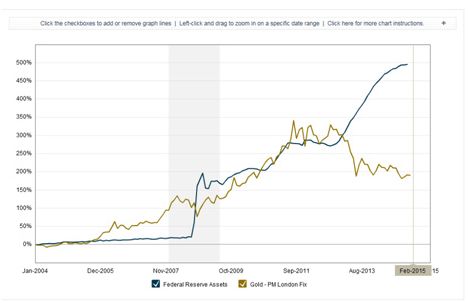
This chart courtesy Macrotrends.net shows the correlation between Assets at the Federal Reserve (blue), and the price of gold. Historically the two travel together. The current wide gap between the two can be resolved by either the FED reducing these assets (who would buy them? – these include ‘assets’ bought from banks during the 2008 crisis). The expectation is that gold will soon play ‘catch up’.
“The law can be an instrument of equalization only as it takes from some persons and gives to other persons. When the law does this, it is an ‘instrument of plunder.’” Frederic Bastiat
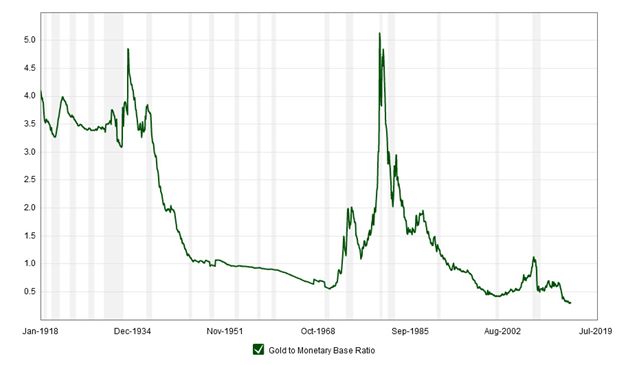
This chart is also courtesy Macrotrends.net. It compares gold to the US Monetary Base. When MB is rising (as now), while gold is correcting (as recently), this index turns lower and starts to warn us that gold is underpriced. The current ratio at 0.31 is the lowest in over 100 years! The time to sell gold is when this ratio is at 3.25 or higher. The way to preserve purchasing power and to protect net worth, is to buy gold when it is cheap. In order to ‘sell high’ we must first ‘buy low’.
Please do your own due diligence. Peter Degraaf is not responsible for your trading decisions.


THANK YOU for the tribute to Bastiat. You got french spirited.. come again, Paris is not all of France.. and there are CHARLIEs (moderate muslims included) everywhere, for Charlie is the quintessence of french wit.. against all obscurantism. And be sure muslim french citizens prefer to live under secular rule than islamist rule : they may have a beer when thirsty.
It's certainly horrible what's happening over in France now, my heart goes out to the country. But I enjoyed this article even more for the excellent charts and commentary. Well done.
Why didn't I buy gold at $500... why why why ;-)
Believe it or not Vintage Vixen, gold is cheaper now at $1215 than it was at $500. This due to the amount of money that has been added to the system since then.
Thanks for the explanation and an excellent post.
Great charts, thank you.