
Investors Jump Back In

Let’s start with last week’s newsletter:
As I noted in my blog entitled “Eating Sardines”:
“For now, it is important to note the ‘bullish trend’ remains solidly intact and, therefore, we must give the ‘benefit of the doubt’ to the bulls.
The market is currently in the process of building a consolidation pattern as shown by the ‘red’ triangle below. Whichever direction the market breaks out from this consolidation will dictate the direction of the next intermediate-term move.”
Well, on Friday, the market made its move.”

“The breakout of this consolidation is nothing but “bullish” in the short-term and requires us to remove our hedge and allow portfolios to run unencumbered for the time being.
The great “bear market” of 2018 officially ended on Friday…for now.
As I have notated above, there are three possibilities for the market as we wrap up the “seasonally strong” time of the year.
- If the market can clear the previous high from mid-February then an advance to all-time highs is quite likely. (50%)
- The market fails to clear resistance, initially, at the mid-February highs, retraces back to the previous downtrend line (which will likely coincide with the 100-dma), completing a successful retest of the breakout and then moves to towards all-time highs. (30%)
- The market fails at mid-February resistance, tests support, and bounces, but fails at resistance a second time and begins a deeper correction.(20%)
I am giving the greatest odds to option (1) for the time being.
However, option (2) and (3) should not be dismissed either. “
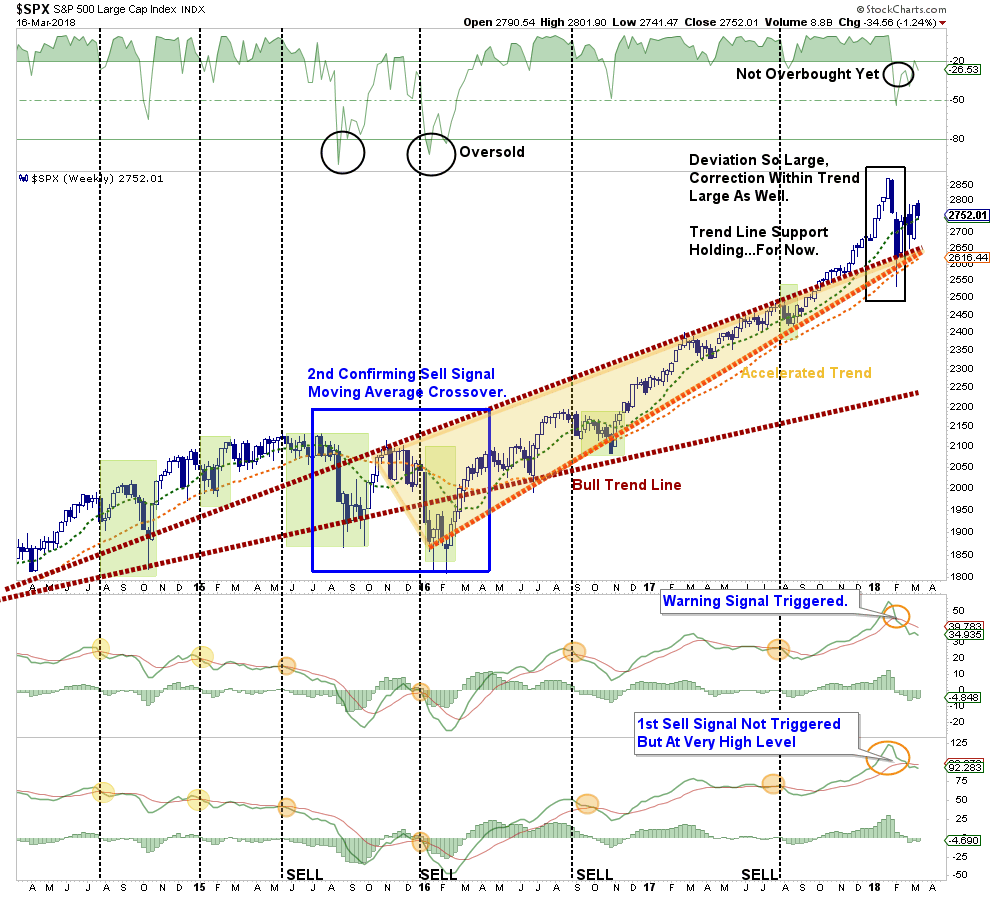
While I gave option (1) the greatest odds, it was option (2) that came to fruition as shown in the updated chart below.

The predicted path of decline, so far, has held at the 50-dma, which is bullish. However, the overbought condition, combined with the previous resistance level, proved too formidable for investors to push the market higher.
More importantly, while the “bullish trend” remains solidly intact, the market did fail at the uptrend resistance line as noted last week.
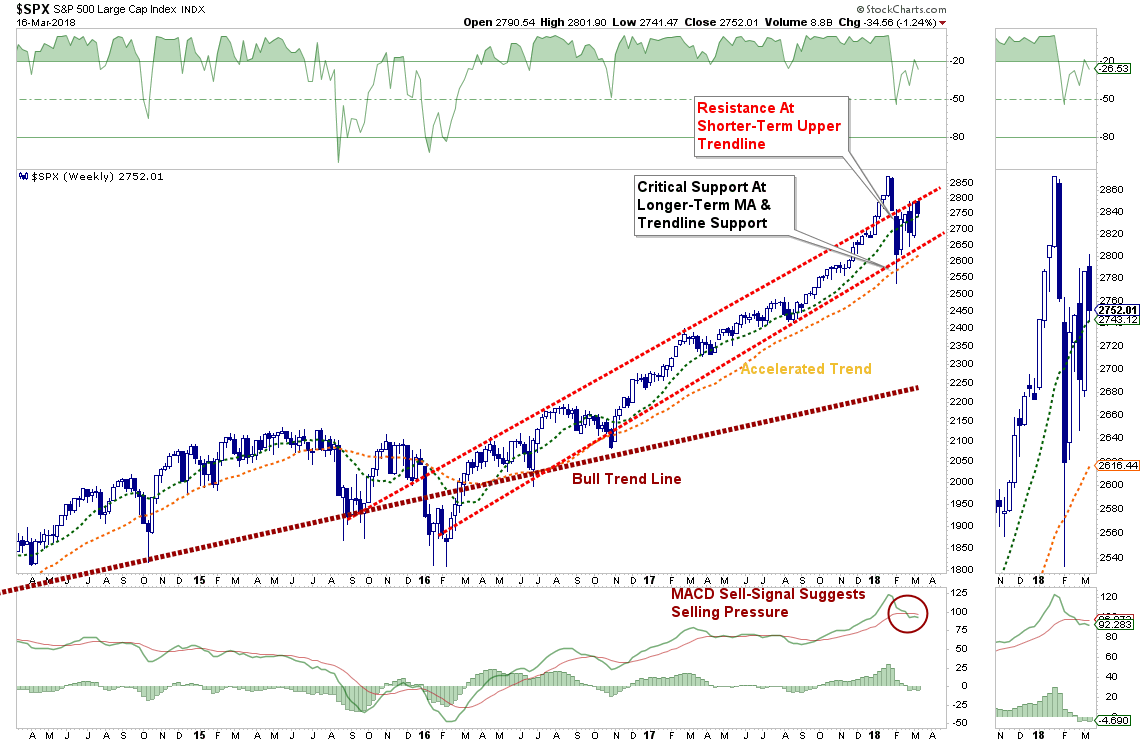
That failure set up the retracement, and retest of the breakout, which also brought options (2) and (3) into focus.
While I have laid out three different options, there are a multitude of paths the market can take. However, in the end, while the exact pattern that plays out could vary wildly, the market is either going to resume its bullish trend or it will break down.
“No kidding.”
I know that sounds excessively simplistic or that I am just “hedging my bets.”
I’m not. I simply do not know with a great deal of certainty where the markets will go next. There are no guarantees in investing and we are all speculating on potential outcomes with our “hard earned” savings. Since we are confined to a consolidation process, betting solely on a “bullish” outcome is dangerous. This is particularly the case when “sell signals” are registered on an intermediate-term basis.
Since, it is the prevention of the loss of investment capital which is paramount to long-term investing success, erring on the side of caution during uncertain times tends to be the better choice. Yes, you could certainly “miss out” on a bit of an advance, should one occur, but portfolios can be quickly readjusted to participate with further gains. Making up lost capital is a different matter entirely.
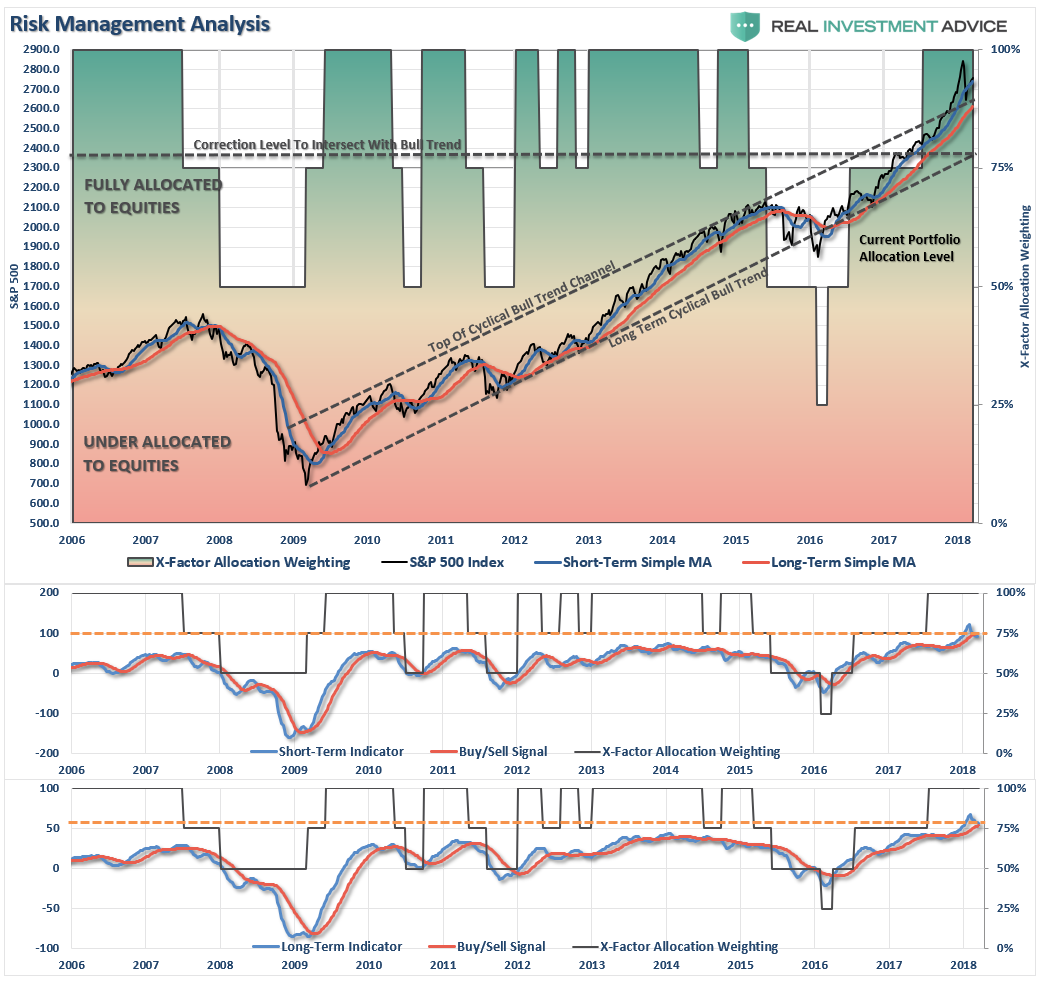
At some point, individuals should question just how much more “juice” there is to squeeze from this particular market given the very overvalued, extended and mature advance. The chart below shows every period where the market, on a quarterly basis, was above its long-term bullish trend line, combined with extremely overbought conditions, and the subsequent correction that occurred.
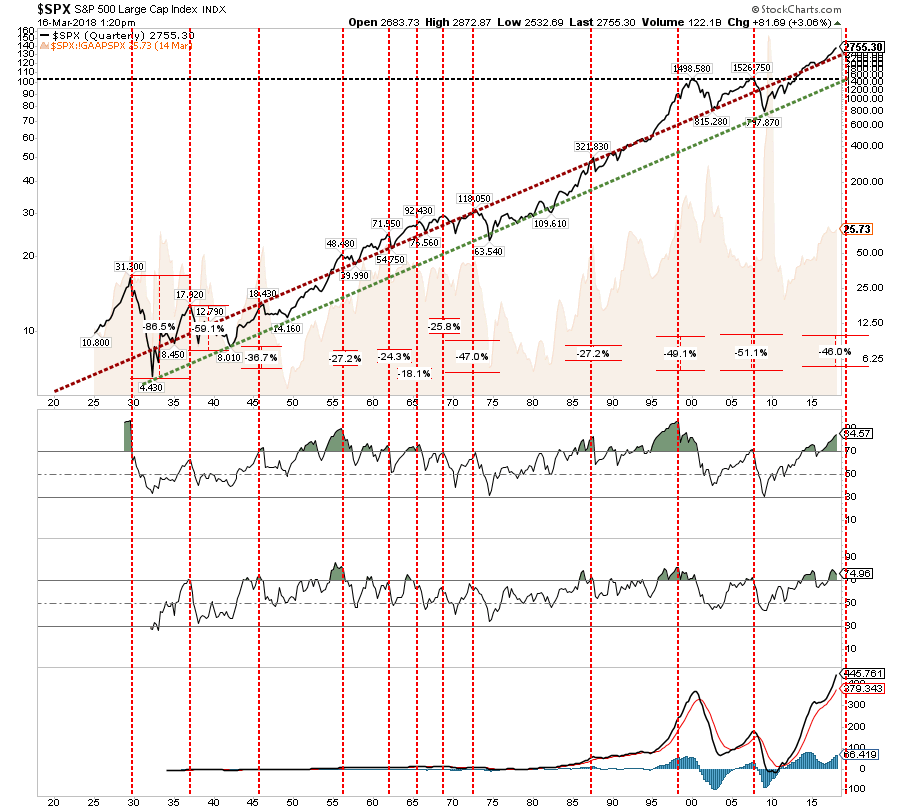
A correction occurred every time all the conditions were me as indicated by the vertical dashed line. Once again all those conditions are met and the subsequent decline from current lines should theoretically approach 50%.
But despite the weight of evidence, investors are once again doing exactly what they always do near market peaks.
Investors Jump Back In
“With the market correction barely a month in the rear-view mirror, investors have jumped back into stocks in record numbers.
Stock-focused funds took in $43.3 billion in fresh cash over the past week, a new peak that reverses much of the angst over the past several weeks, according to Bank of America Merrill Lynch.”
Despite the fact that market remains in a consolidation/correction process, as noted above, the media has already decided the “correction” is over and investors have bought it “hook, line, and sinker.”
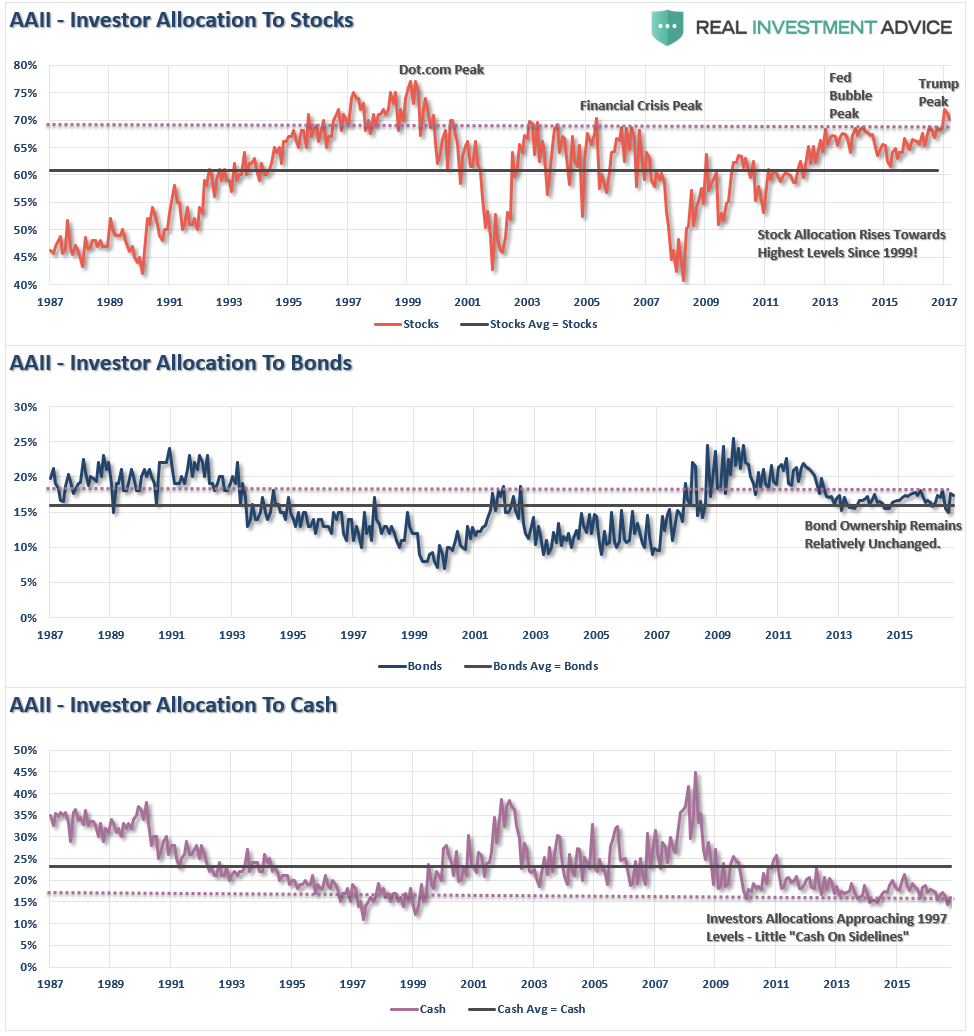
But then again, since the media’s “business” is to sell advertising, the best way to keep fund managers “paying” for ads is to make sure investors keep buying. Not surprisingly, since investors have been repeatedly “taught” to “buy the dip” over the last nine years, it is not surprising to see they did just that. In fact, currently, investors are more long stocks today, and have the least amount of cash, since 1999.
“For the year, stock-based ETFs have pulled in $82.7 billion while bond funds have seen $11.7 billion in inflows, according to FactSet.”
But the media is always good at spinning a story. Read the following sentence carefully:
“Pessimism fell to its lowest level since the first week of 2018, at 21.3 percent a drop of 7.1 percentage points, according to this week’s reading from the American Association of Individual Investors Sentiment Survey.”
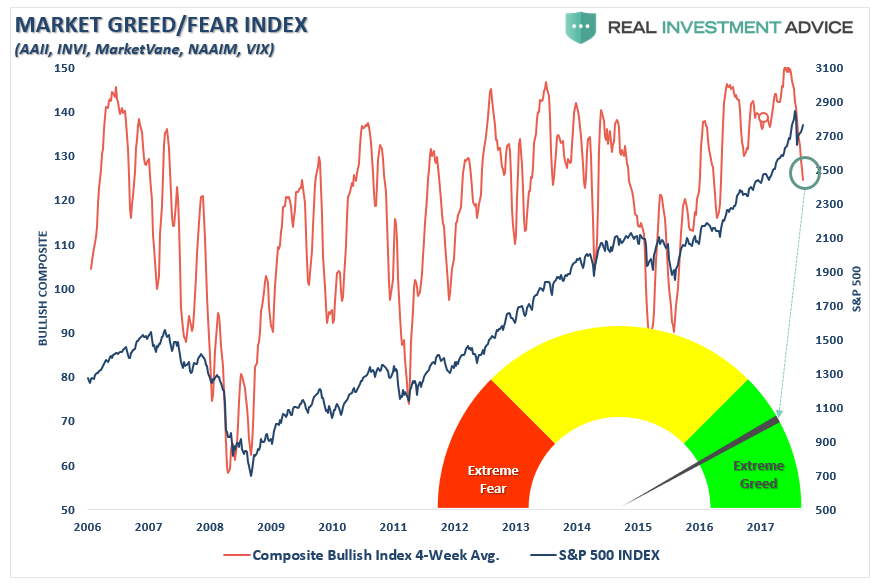
At first read, it sounds as if investors got markedly “bearish” on the markets during the correction. Actually, as shown below, bullish sentiment has only dipped from “extremely bullish” to just merely “excessively bullish".
(The following chart is a composite index of various bullish sentiment indicators and the inverse of the VIX index)
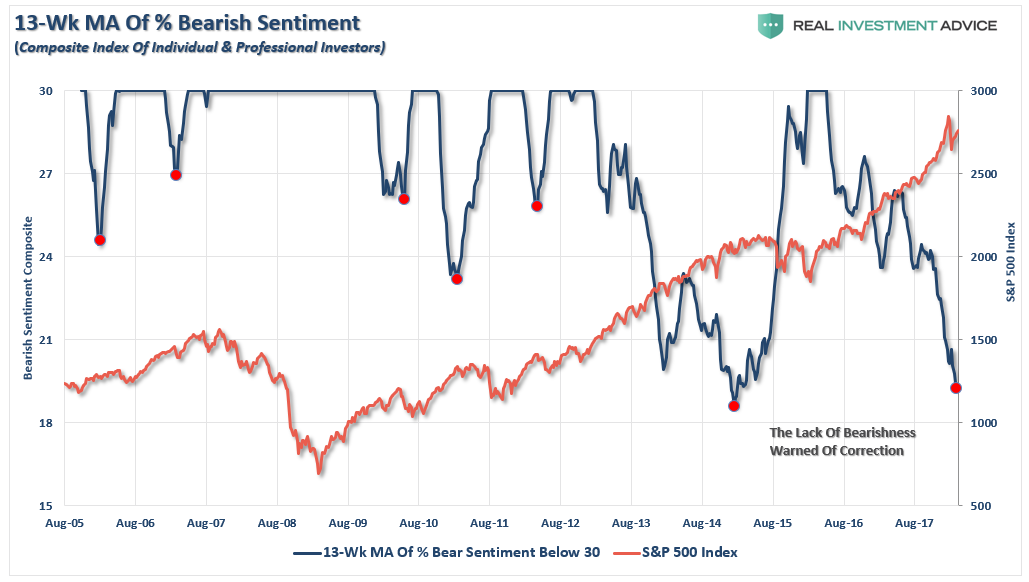
In fact, if we smooth the volatility by using a 13-week moving average, we find that we are once again near the lowest levels on record for a “lack of pessimism.”
But what is there to fear?
After all, every dip since 2009 has been a terrific buying opportunity. Why should this time be different?
Let me repeat something from this past Tuesday’s blog “Chart Of The Year,” in case you missed it:
“Yet the time of this unprecedented monetary experiment is coming to an end as we are finally nearing the point where due to a growing shortage of eligible collateral, the central bank support wheels will soon come off, resulting in gravity finally regaining control over the market’s surreal trendline.
Appropriately, this central bank handoff is also the topic of the latest presentation by Matt King, in which the Citi creditstrategist once again repeats that ‘it’s the flow, not the stock that matters’, a point we’ve made since 2012, and underscores it by warning – yet again – that ‘both the world’s leading marginal buyers are in retreat.’ He is referring to central banks and China, the world’s two biggest market manipulators and sources of capital misallocations.”

With markets heavily leveraged, global growth beginning to show signs of deterioration, breakeven inflation rates falling, and liquidity support being removed – the markets have yet to recognize the change.
But when they do, the consequences to complacent investors have been nothing short of brutal.
Be sure to “look before you leap.”
Bonds & Oil
by Jesse Colombo
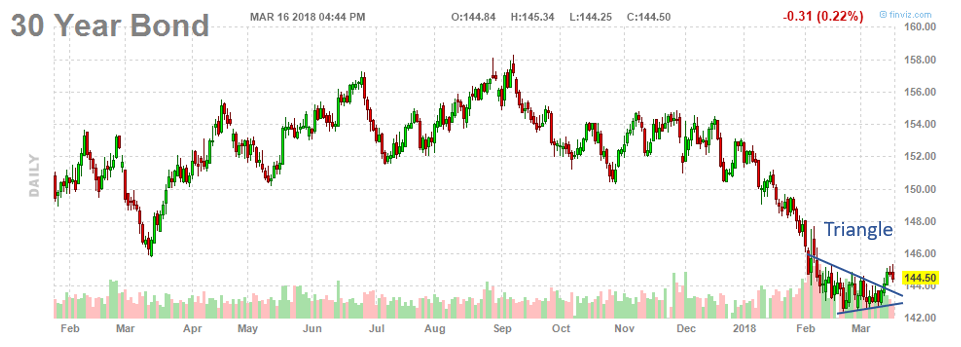
On Wednesday, I wrote a brief piece called “Are U.S. Treasury Bonds Breaking Out?” in which I showed how Treasuries had broken out of a triangle pattern thanks to weak inflation and retail sales data, along with falling Q1 GDP estimates. I found the situation interesting because I’ve been showing how the “smart money” has been bullish on Treasury bonds (and bearish on yields). I am curious if this breakout emphasizes that I was not predicting what was going to happen per se, but just making observations. In this update, I wanted to outline a scenario in which this recent Treasury breakout may turn out to be a head-fake or a false breakout, which is something that must always be kept in mind when watching a technical breakout.
The chart below shows the recent breakout in the 30-year Treasury bond (the charts of the 10-year and 5-year look similar):
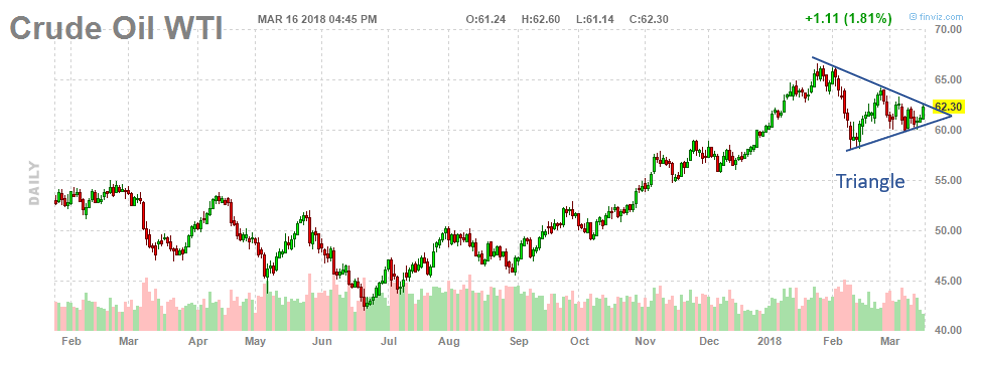
I have also been watching a triangle pattern form in crude oil. I will admit, I do not know which way this is going to break out in advance, but I am open to all possibilities. I don’t make short-term market predictions; I prefer taking a reactive approach. I just wanted to point out that an upside breakout from this crude oil triangle would increase the chances of a breakout failure in Treasuries (because Treasuries and crude oil trade inversely). If crude oil breaks down from this triangle, however, it would likely provide more fuel for the recent bullish Treasury breakout. I will keep everyone updated.
Market & Sector Analysis
Data Analysis Of The Market & Sectors For Traders
S&P 500 Tear Sheet

Performance Analysis
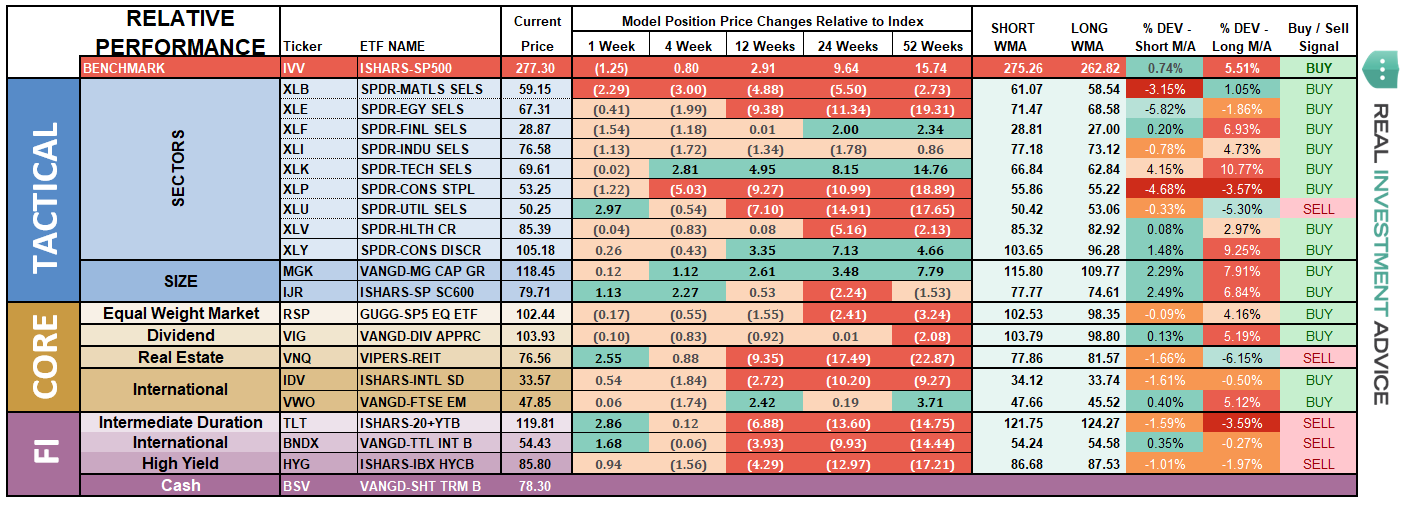
ETF Model Relative Performance Analysis
Sector & Market Analysis:
Three weeks ago, as the market struggled with its intermediate-term bullish trend line, I laid out two possible trajectories previously based on these support and resistance levels. I have updated the chart through Friday.
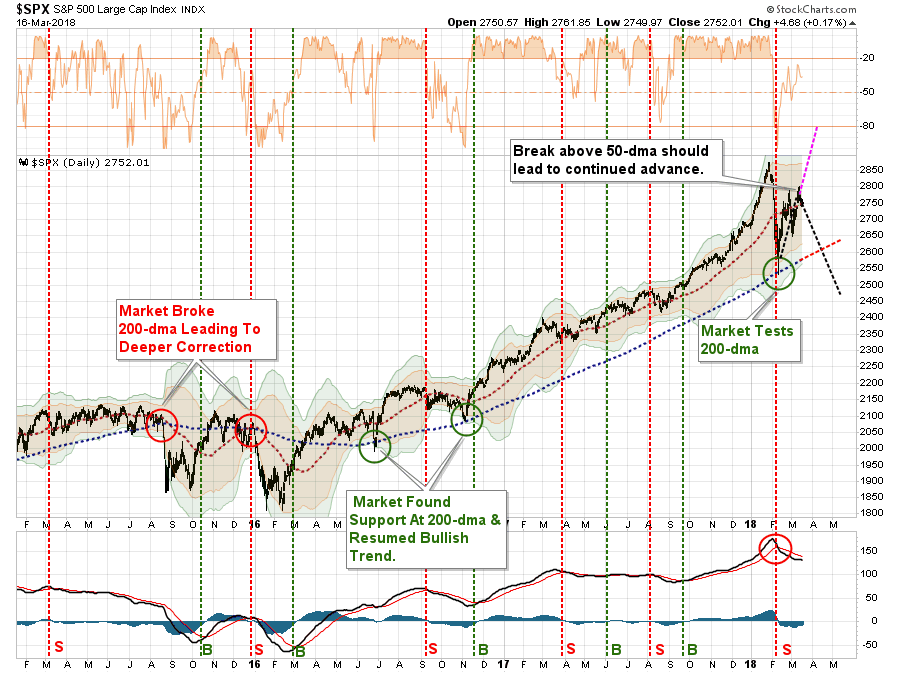
With the “sell signal” firmly in place on a short-term basis, the selling pressure has continued to press prices lower over the past week following the project path. The market needs to gain some solid footing next week, or weakness could become more pervasive.
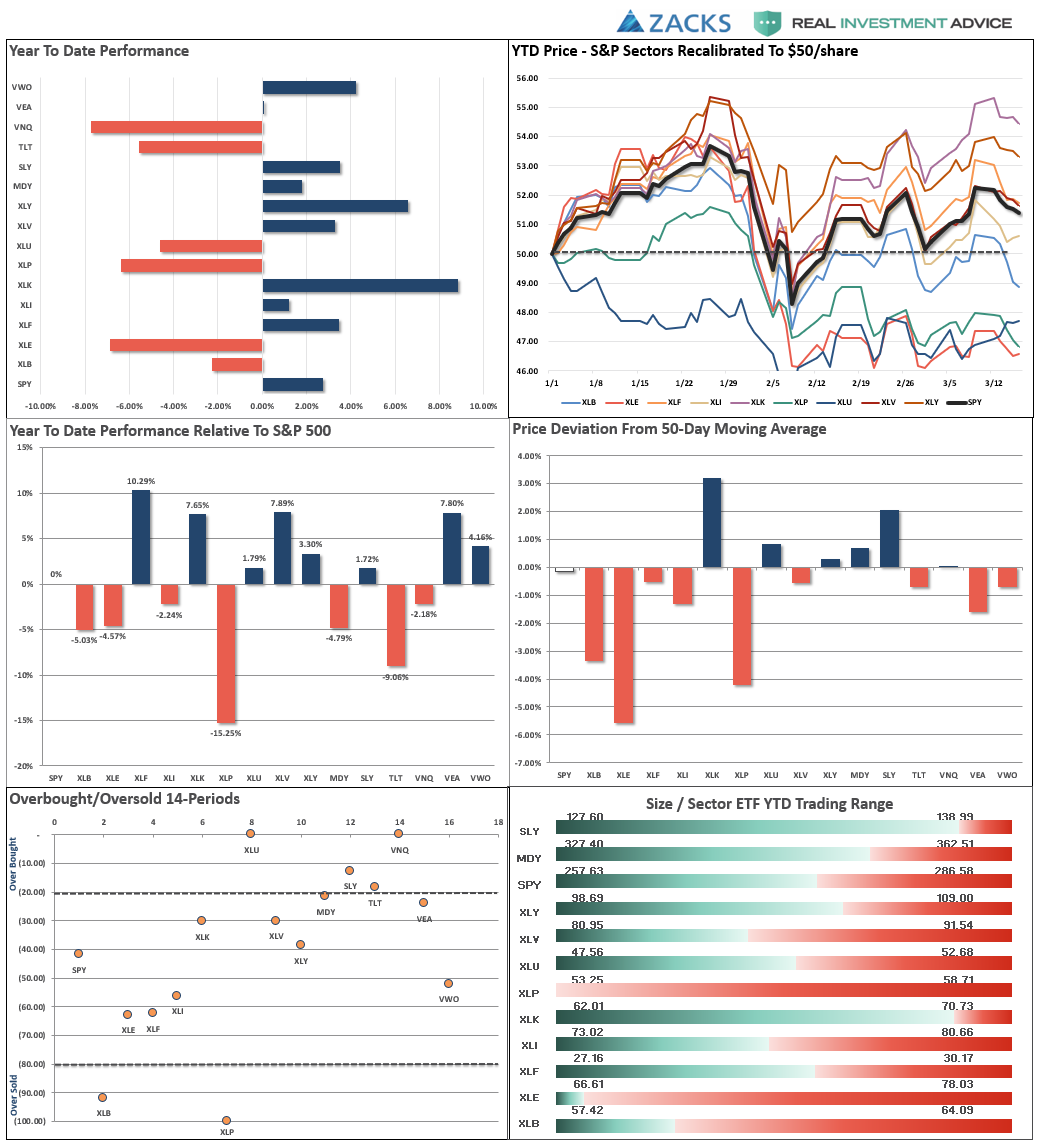
Let’s review the major market sectors.
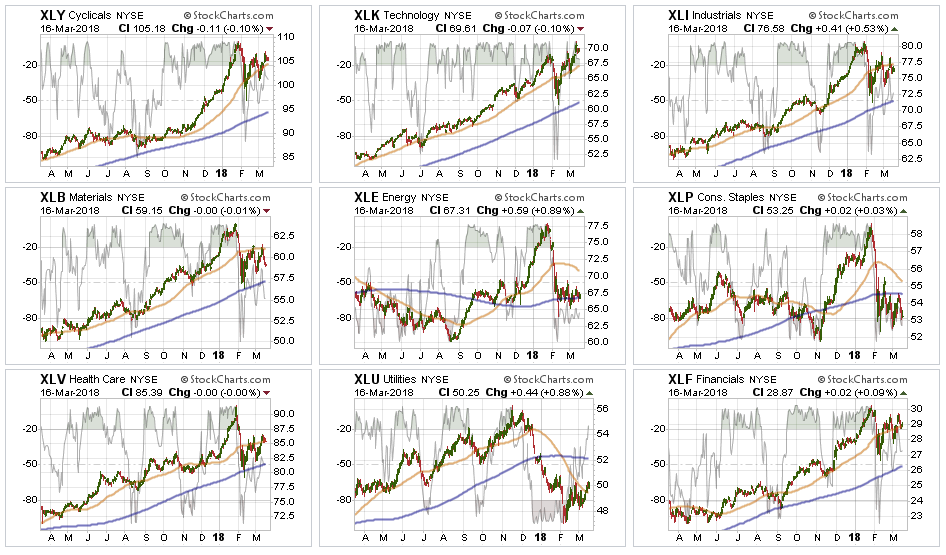
Discretionary, Technology, Health Care, Industrials, and Financials broke back through their respective 50-dma with Technology breaking out to an all-time high last week. These sectors were hit with profit taking this past week, but bullish trends remain clearly intact. After having recommended taking profits and reducing weightings, these sectors are exhibiting the best relative strength.
Industrials, Materials, and Energy – we were stopped out of our small additional Energy trade with the break back below the 200-dma, and we closed out our Materials trade on potential “tariff” risk. Industrials are now added to the list of those on the “watch, wait and see” list with the break below its 50-dma. Tariff risk continues to rise and Larry Kudlow as National Economic Advisor is not likely to help the situation as his “strong dollar” views will NOT be beneficial to these three sectors.
Staples and Utilities have continued to underperform in recent weeks. However, as I stated last week:
“I suspect the opportunity for these sectors to shine is coming as the realization of weaker economic growth and deflationary pressures become more visible, but that could be later in the year.”
We saw a nice rally in Utilities and Bonds this past week, as safety was sought over risk. We will see if that continues. Rebalance holdings accordingly to underweight the sectors for now.
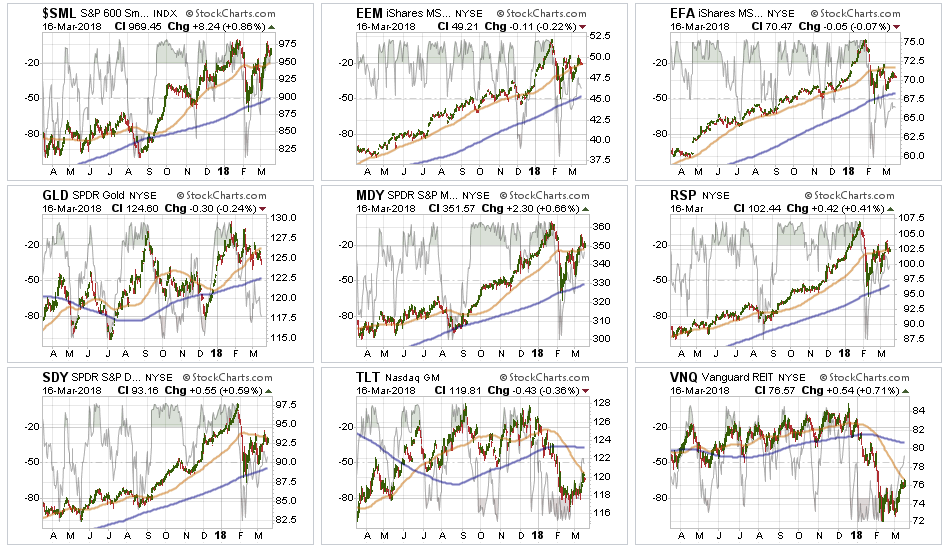
Small Cap, Mid Cap, Emerging Markets, Equal Weight, and Dividend indices all broke back through their 50-dma last week. They remain that way this week, with the exception of Equal Weight and Dividend yield which are struggling with resistance currently. Last week, we reduced weights in international exposure due to the likely impact to economic growth from “tariffs” on those markets and that market has continued to weaken again this week.
Gold broke back below its 50-dma last week and has recently put in a “double top”further reinforcing overhead resistance from last September. We currently do not have exposure to gold, but if you are already long the metal, the backdrop overall remains bullish but a correctional phase may be approaching so taking profits is likely wise.
Bonds and REITs over the last couple of weeks, these two sectors looked to have bottomed and initiated early “buy” signals. Hold positions for now as interest rates have started to recognize the economic weakness that has shown up in the data as of late.
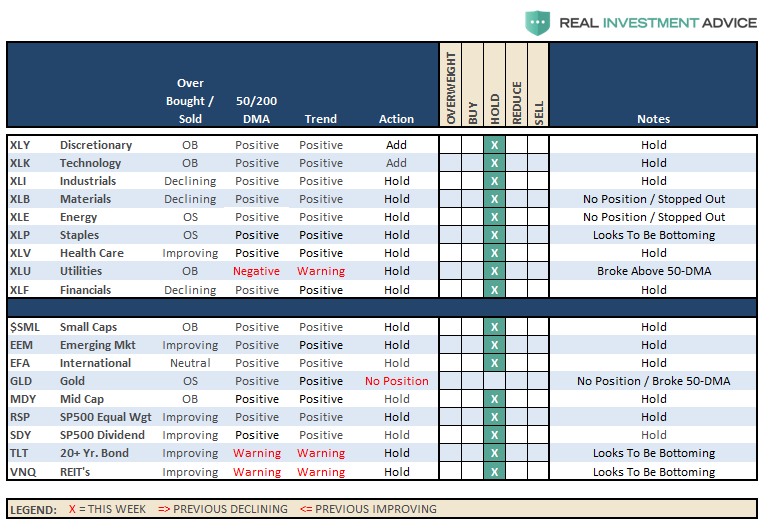
Sector Recommendations:
The table below shows thoughts on specific actions related to the current market environment.
(These are not recommendations or solicitations to take any action. This is for informational purposes only related to market extremes and contrarian positioning within portfolios. Use at your own risk and peril.)
Portfolio Update:
Last week, we rebalanced portfolios after the markets broke back above the 50-dma on a weekly basis. This past week, although the market struggled, the market retested, and remained above, that level of support.
We continue to monitor the markets carefully as risk has clearly risen since February. However, with the bullish trend clearly intact, we don’t want to be overly cautious. While the level of investor optimism is high, and more indicative of turning points in the market, such does not mean it will happen immediately. With the weakness that prevailed last week, a rally early next week off of the 50-dma will not be surprising.
As noted last week, most of our positions still remain within their bullish tolerance bands. However, we did make minor tweaks to allocations while remaining well aware of the longer-term risks. Furthermore, we remain keenly aware of the intermediate “sell signal” that currently persists which keeps us focused on risk management and capital preservation.
THE REAL 401k PLAN MANAGER
The Real 401k Plan Manager – A Conservative Strategy For Long-Term Investors
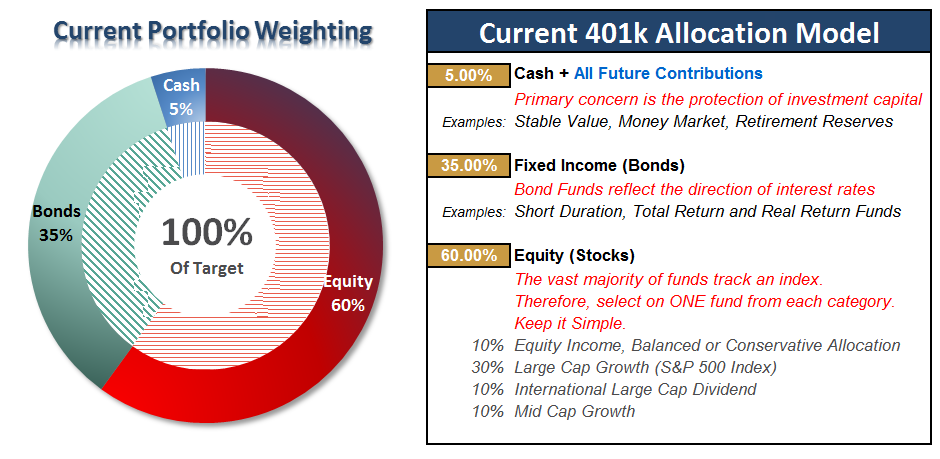
There are 4-steps to allocation changes based on 25% reduction increments. As noted in the chart above a 100% allocation level is equal to 60% stocks. I never advocate being 100% out of the market as it is far too difficult to reverse course when the market changes from a negative to a positive trend. Emotions keep us from taking the correct action.

Still Consolidating
As noted last week, the market broke out of its consolidation last week, confirming the bullish bias. This week, it retested support at the 50-dma and held which is a positive.
After rebalancing portfolios last week to target allocations, as shown below, there is little to do this week but wait to see what happens next.
While the bullish trend is intact, we are nearing the end of the seasonally strong time of year. Furthermore, the things happening in Washington are NOT beneficial for the economy or the markets. So pay attention – policy does matter.
The model below is just a “sample” allocation. Feel free to adjust the weights according to your own age, risk tolerance and goals.
Importantly, while the market is “bullishly biased” short-term, the longer-term picture of increased volatility, low-forward returns and capital destruction risks still prevail. If you are near retirement, moderate your allocation accordingly to reduce the risk of loss.
Current 401-k Allocation Model
The 401k plan allocation plan below follows the K.I.S.S. principle. By keeping the allocation extremely simplified it allows for better control of the allocation and a closer tracking to the benchmark objective over time. (If you want to make it more complicated you can, however, statistics show that simply adding more funds does not increase performance to any great degree.)
401k Choice Matching List
The list below shows sample 401k plan funds for each major category. In reality, the majority of funds all track their indices fairly closely. Therefore, if you don’t see your exact fund listed, look for a fund that is similar in nature.

Disclosure: The information contained in this article should not be construed as financial or investment advice on any subject matter. Real Investment Advice is expressly disclaims all liability in ...
more

