
How High Could Crude Oil Go?
On Wednesday, the black gold gained 1.13% after encouraging the EIA weekly report. As a result, light crude climbed to the previously-broken lower border of the trend channel, but closed the day below it. Will we see further improvement in the coming days?
Although yesterday’s EIA weekly report showed that crude oil inventories rose by 118,000 barrels in the previous week (missing expectations of a draw), the report also showed that gasoline inventories, dropped by 894,000 barrels (beating analysts’ forecasts), while distillate stockpiles declined by 223,000 barrels and beat expectations of a rise of 453,000 barrels. This bigger-than-expected drop in gasoline inventories eased worries about a slowdown in demand for refined products, which supported the price of the black gold. As a result, light crude climbed to the previously-broken lower border of the trend channel, but closed the day below it. Will we see further improvement in the coming days?
Crude Oil’s Technical Picture
Let’s take a closer look at the charts and find out (charts courtesy of http://stockcharts.com).
Yesterday, we wrote the following:
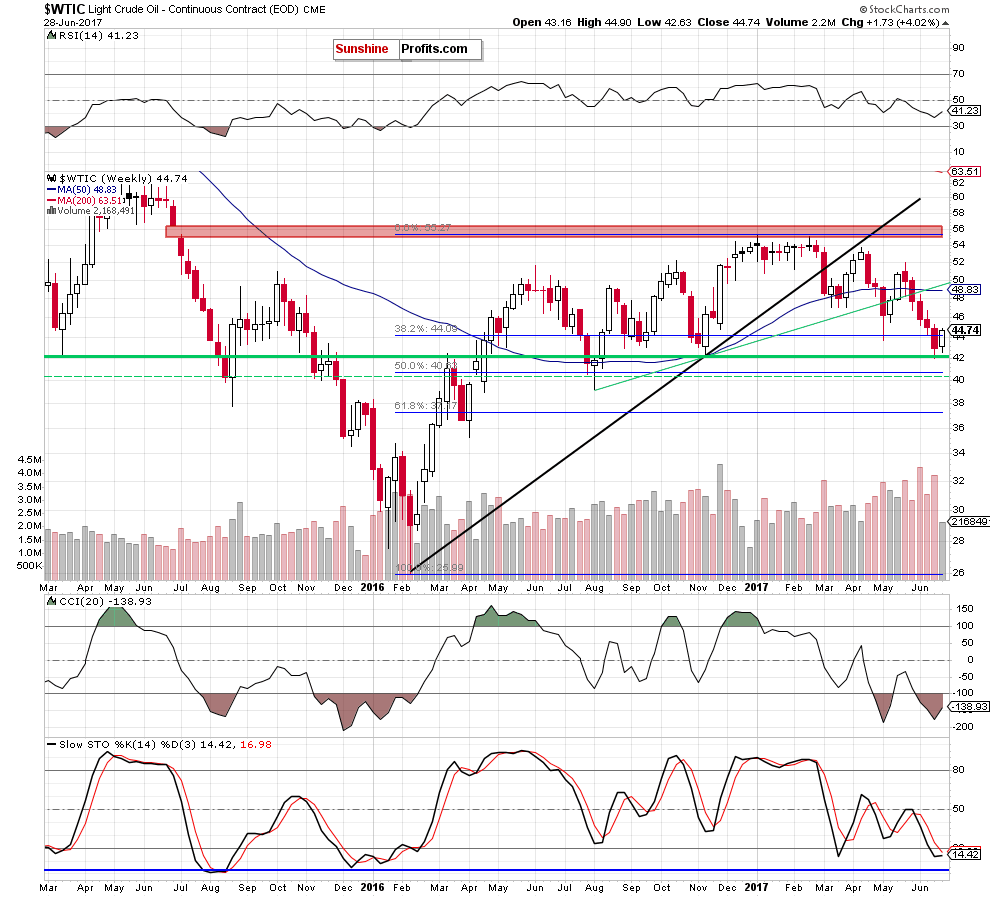
(…) crude oil extended gains, which resulted in a climb above the previously-broken 38.2% Fibonacci retracement. In this way, the commodity invalidated the earlier breakdown, (…) bounced off the green zone and closed the day above $44.
What’s next for Crude Oil?
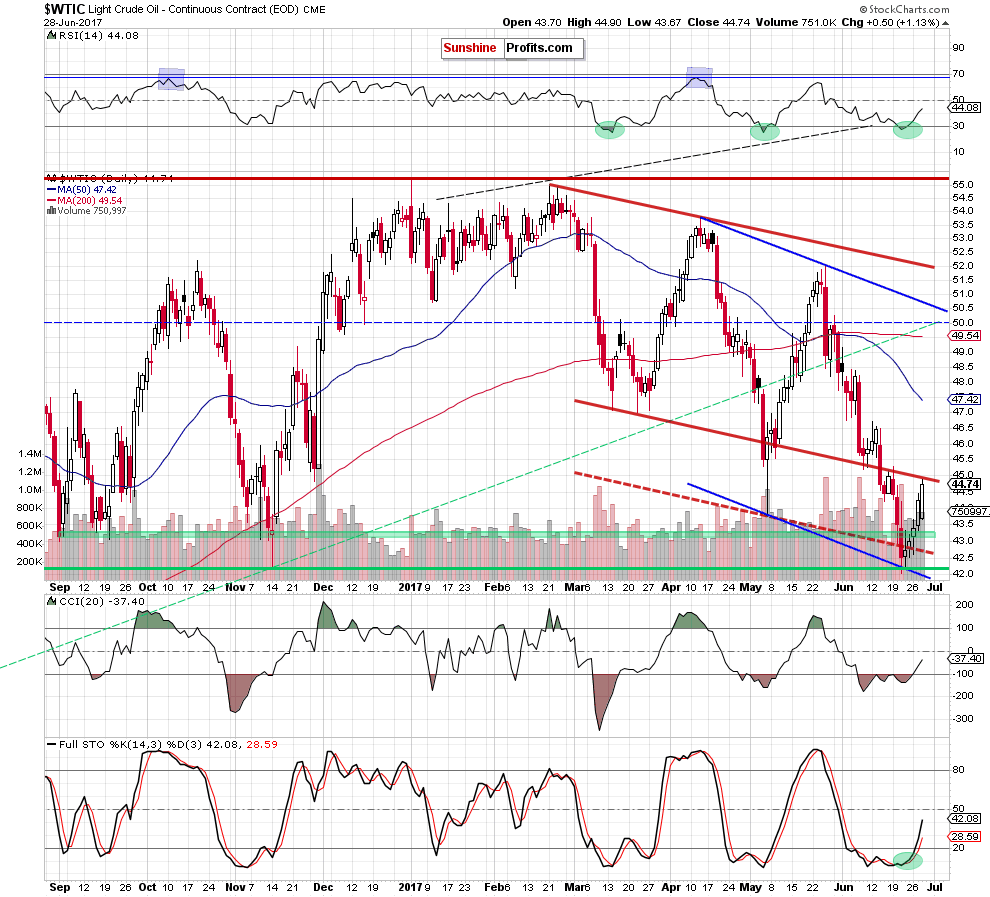
Taking into account yesterday’s price action, the buy signals generated by the daily indicators and the medium-term picture, we believe that (…) the first upside target will be around $45, where the previously-broken lower border of the red declining trend channel is.
From today’s point of view, we see that crude oil extended gains (making our long positions more profitable), which resulted in a climb to the above-mentioned first upside target. Although this resistance could pause oil bulls, the buy signals generated by the indicators remain in place, supporting further improvement. Additionally, an invalidation of the breakdown under the 38.2% Fibonacci retracement and its positive effect on the price remain in cards, which suggest a climb above $45 in the coming days.
How High Could Crude Oil Go?
If this is the case and we see such price action, the next upside target for oil bulls will be around $46.50-$46.71, where the mid-June highs are. If this resistance is broken, we may see an increase to $48.20-$48.42 (early June highs) or even to the upper border of the blue declining trend channel (currently above the barrier of $50).
Summing up, long (already profitable) positions continue to be justified from the risk/reward perspective as crude oil extended gains and climbed to the previously-broken lower border of the red declining trend channel.
We encourage you to


Thanks for sharing
Thanks for sharing
Nadia, I note in your article references to "light" crude oil. I think the readers of your article will be interested in an article entitled "Crude Oil: How 'Sweet' It Can Be!" (www.munknee.com/crude-oil-how-sweet-it-can-be/) that:
>says there are over 160 different oils traded on the market theses days and
>identifies & describes the 3 primary types of crude oil and each of their characteristics.