
Gold/Silver Ratio Back At Extremes
The gold/silver ratio, calculated by simply dividing the gold price by the silver price, may be signaling the end of the bear market in metals is drawing near. That could be good news for gold investors and great news for those who hold silver.
First, let's take a look at a long-term chart of the ratio:
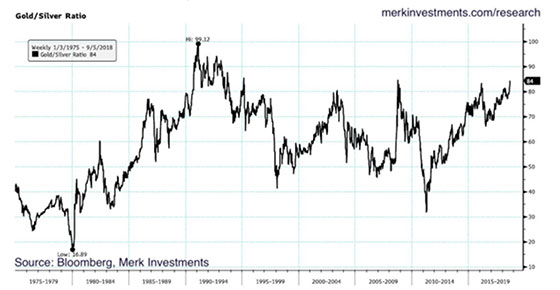
The 1980 low in the ratio coincided with the blow-off top in the silver price at $50/oz. Both metals fell sharply after that peak, and silver underperformed gold for the majority of the next 11 years.
The gold/silver ratio peaked in 1991 when it spiked to almost 100. Gold was priced near $400/oz and silver near $4. Since that peak, the ratio has spent the majority of its time bouncing between about 40 on the low end and 70 on the upper end of the range.
Today it takes about 84 ounces of silver to buy a single ounce of gold. That looks like an opportunity. If the past 40 years are a guide, now would be a good time for metals investors to favor silver.
There have been 7 instances where the gold/silver ratio exceeded 80. Six of them represented a top with the ratio falling sharply (silver outperforming) very soon afterwards.
We think history is likely to repeat here and that silver will outperform gold in the years ahead.
We strongly suggest favoring silver any time the ratio hits 80 or more. And we believe investors should continue overweighting silver until the ratio gets to 50 or below.
It could ultimately go much lower. In fact, we won't be surprised if the gold/silver ratio gets back to the 1980 low below 20 before the next bull cycle in metals is over.


