
Gold's Golden Ratio Retracement
Gold plunges for its worst percentage weekly loss since last November. Nobody knows why. Nothing has changed.
First Things First
- On a percentage basis, this was Gold's worst week, -4.6%, since that ending last 06 November
- On a points basis, this was Gold's worst week, -60 points, since that ending 13 September 2013
- Tuesday was Gold's worst daily percentage loss, -3.3%, since 26 June 2013
- Tuesday was Gold's worst daily points loss, -44 points, since 12 September 2013
- The Whiny 1290's, from which Gold could barely move for over a year, didn't hold a wit
- The 1280-1240 Support Zone was essentially hoovered from top to bottom, but has held
- Gold was purchased throughout the final five hours of the trading week (+16 points or +1.3%)
Now as you regular readers can imagine, our omnipresent, omnidirectional condenser microphones continue to pick up the cacophonous hubbub from just outside this bureau's door to as far away as Tristan de Cunha's remote archipelago. Yet our venerable Miss Gibbs, in translating the spectrum of talking tongues and boiling down the vast array of musings and surmises, has summarized it all into a single phrase: "What's he gonna say this time?"
For the easiest answer, I don't have to say anything. Rather, let's throw it to a veteran gold equities investor and highly valued reader, whose post-gold plunge words come Wednesday were: "So I was up 120% for the year, now I'm up 70%. What's to complain about?"
To be sure, no one likes getting creamed as were the gold longs this past week. But here's the neat bit that started to become apparent as the dust settled and gold consolidated over the last two days of the trading week: basis current "front month" December contract pricing, from last year's low (1053) to this year's high (1385), gold's settling out the week yesterday (Friday) in the 1258 handle was spot on the perfect Golden Ratio retracement. Clearly lurking about out there watching the herd respond to his mathematical perfection was our ole buddy Leonardo "Fibonacci" Bonacci. His is the middle of the three black horizontal lines in this view of Gold by the week from last year's low through this year's high:

Yes, the lads are quite enthusiastic there in the above graphic. While "catching the falling knife" is often proven to be "a bad idea", the aggressive trader could take a shot on the Long side here, as they say "with a stop below the last low", (the week's low was 1243). But should the 1280-1240 support zone morph back into resistance, gold by our reckoning shall have then suffered technical damage; indeed, some might opine that it already has. Still, we've been pointing time and again to the overall swath from 1290 down to 1240 as substantive support for gold: let's now see if it can hold, despite it's being so thoroughly sold.
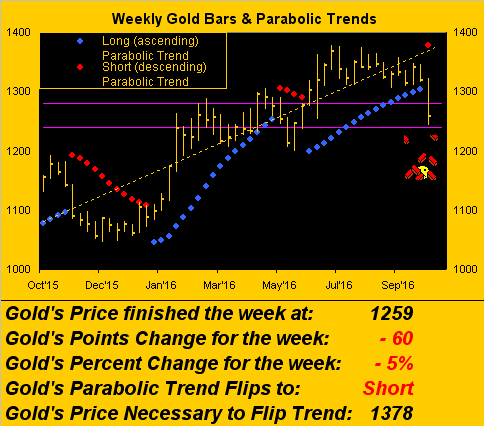
As for the "rationale" being bandied about for the "sell", we sensed none beyond "selling-begetting-selling." To which end as was pointed out in last week's missive entitled "Gold Treads Water through the Third Quarter", the parabolic Long trend across gold's weekly bars was easily in range to get flipped to Short, which it swiftly then did. The purple lines bound the 1280-1240 support zone itself:
Of course, some say the plunge was triggered by sterling hitting lows against the dollar on Tuesday not seen since 1985; but with the exception of Friday's "after the fact" flash-crash, sterling had already been meandering down for months post-Brexit vote, hardly such as to justify gold's plunge. So nothing new there. Also pre-plunge, Bloomberg Radio interviewed Cleveland Fed Head Loretta Mester, who reiterated her view that the Federal Reserve Bank ought raise rates straightway. So nothing new there. The Economic Barometer, as we'll see, has been slithering up of late, but hardly dramatically. So nothing new there. The oft-thought "contra-to-gold" S&P 500 has been anything but robust. So nothing new there. And further, the Dollar Index traipsed up a tad to where it was in early August when gold was in the 1350 area. So nothing new there. Indeed, here are the 21-day percentage tracks of gold, the S&P and Dollar over the last 21 trading days (one month). And quite surprising for gold there:

Perhaps less surprising is the aforementioned rise of late in the Econ Baro; after all, it is that time of this particular year. "Oh Loretta? Why don't you and your Federal Open Market Committee mates simply vote to raise your Funds rate at the 01/02 November meeting? What's that? Oh, job security. Right. Very considerate of you to think of her. Yes, yes, we can all clearly see what happened last time you raised, Loretta", (when annualized GDP growth then at +2.1% was higher than presently 'tis at +1.4%):

Politics or otherwise, the Baro's rise has incorporated both growing Consumer Credit and Confidence, improvements in the Institute for Supply Management Indices as well as in the Chicago Purchasing Managers' Index, Inventories work-downs, big leaps in both the Philly Fed Index and the National Association of Home Builders Index, plus an upturn in retail inflation. Elsewhere, we read during the past week that, although the EuroZone's growth was slowing, rising demand in the region served to improve manufacturing activity, notably in Germany. However in contrast, we see that China's growth rate continues to slow as its debt growth accelerates such that a "hard landing" can only be in the offing. How are those now Yuan-laced Bank for International Settlements Special Drawing Rights working out for you?
Getting back to the precious metals, we've the following two-panel graphic of daily bars for both gold on the left and silver on the right. Those of you who took last week's missive to heart as the "Baby Blues" -- those dots that depict the day-by-day consistency of the 21-day linear regression trend -- were going sub-zero probably sensed that gold and silver were in for a down week, (just not this much down!):

And the present prices of the pair obviously are well-down in their respective 10-day Market Profiles as we here see for gold (left) and silver (right): The sharp-eyed trader might therein observe given such relatively little volume having been traded through the center of both panels, that "snap-back, fill-the-gap" rallies could quickly place gold back above 1300 and silver back above 19:

Now let's bring up from the website a core daily graphic that we've not herein presented for quite a while, but it is quite telling to now so do. These are gold's daily settles from one year ago-to-date along with its smooth, pearly valuation line. This differs radically from our scoreboard valuation for gold (which you can see at this piece's opening is presently 2652 by currency debasement). Rather, in refreshing your memory, the smooth line is a near-term value for gold based upon its daily changes relative to those of the primary markets that make up the BEGOS complex (Bond / Euro / Gold / Oil / S&P). What is evident in this case is that gold has strayed well off course to the downside vis à vis how it typically interacts with the balance of the other four BEGOS Markets, which seemingly are oblivious to gold's plight. The lower portion of the graphic is the oscillator (price minus valuation), which suggests gold "ought be" some 70 points higher (at 1328) than it is:

In closing, given gold's pounding, let's see where it sits within the stack:
The Gold Stack
Gold's Value per Dollar Debasement, (from our opening "Scoreboard"): 2652
Gold’s All-Time High: 1923 (06 September 2011)
The Gateway to 2000: 1900+
Gold’s All-Time Closing High: 1900 (22 August 2011)
The Final Frontier: 1800-1900
The Northern Front: 1750-1800
On Maneuvers: 1579-1750
The Floor: 1466-1579
Le Sous-sol: Sub-1466
The Weekly Parabolic Price to flip Long: 1378
Base Camp: 1377
Year-to-Date High: also 1377 (06 July) or 1385 basis the December '16 contract
10-Session “volume-weighted” average price magnet: 1299
Neverland: The Whiny 1290s
Trading Resistance: 1270 / 1287 / 1313 / 1327 / 1341
Gold Currently: 1259, (expected daily trading range ["EDTR"]: 17 points)
Trading Support: 1257
10-Session directional range: down to 1243 (from 1346) = -103 points or -8%
Support Band: down to 1240 (from 1280)
The 300-Day Moving Average: 1209 and rising
Year-to-Date Low: 1061 (04 January)
It is still quite early in October. And already from Friday a week back through Friday we've had mutually exclusive flash-crashes in both the Swiss Franc (purportedly induced by die Schweizerische Nationalbank itself) and sterling as we've noted. Now gold's been garrotted by who knows whom on nothing new. Some FedFolk are singing "rate hike" despite GDP growth being notably slower than at last December's hike. (In fact, we caught a bit of Martin Barnes [BCA's Chief Economist] this morning going on in his always affected gravelly voice about the Fed's models being sufficiently archaic such that they don't work anymore, yet nobody seems bothered to fix them; brilliant stuff). A little bit of Black Swan here and a little bit of Black Swan there. And though it all, the S&P 500 continues complacently lollygagging along, lacking earnings, yet loving its national savings account role. We've 16 trading days left in October. Gold has made a Golden Ratio retracement. Whose turn is next? Tick-tick-tick-tick-tick...
Disclaimer: If ever a website needed a Disclaimer, this is it. ...
more


thanks for shaing