
Gold Prices Stall At 1-Month High As Markets Digest AHCA Fail
Gold prices edged lower as the US Dollar recovered alongside front-end Treasury bond yields, undermining the relative appeal of anti-fiat and non-interest-bearing assets. The move appeared corrective as the markets digested last week’s failure of the AHCA healthcare reform bill, as expected.
From here, Fed-speak remains in focus as comments Charles Evans, Eric Rosengren and John Williams of the central bank’s Chicago, Boston and San Francisco branches cross the wires. They may not prove market-moving however as fiscal policy uncertainty sees officials hew closely to the status-quo outlook.
Crude oil prices ticked higher but remained firmly locked within a now-familiar range above the $47/bbl figure. Newswires chalked up gains to reports that Libya cut shipments form the Sharara oil field, its biggest. From here, the official EIA weekly inventory flow data is in the spotlight.
Economists expect to see that US stockpiles rose by 1.03 million barrels last week. A private-sector estimate from API pointed to a larger 1.9 million barrel gain over the same period. That release passed mostly unnoticed however. It’s not clear that the same wouldn’t be the case if EIA data confirmed the larger build.
Also of note, Russian President Vladimir Putin and Energy Minister Alexander Novak are due to speak at the Arctic Forum in Arkhangelsk. Comments hinting at how willing they are to extend the supply cut deal struck between OPEC and top producers outside the cartel last year may be market-moving.
Retail traders are net buyers of gold. What does this mean for the trend? Find out here!
GOLD TECHNICAL ANALYSIS – Gold prices paused to digest gains ahead of major resistance in the 1263.87-65.23 area (February 27 high, 50% Fibonacci expansion). A daily close above this threshold sees the next upside barrier at 1281.88, the 61.8% Fib. Alternatively, a turn back below the 38.2% levelat 1248.58 – now recast as support – exposes the 23.6% expansion at 1227.99 anew.
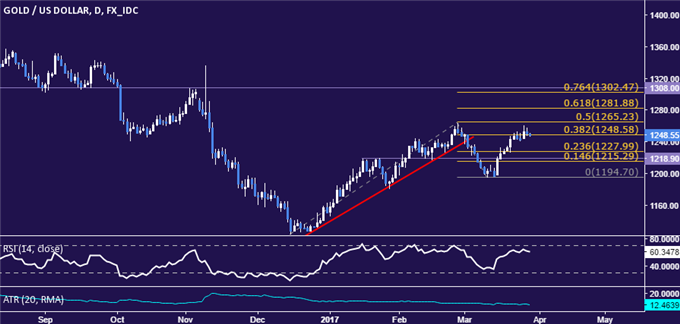
Chart created using TradingView
CRUDE OIL TECHNICAL ANALYSIS – Crude oil prices remain range-bound above critical support at 47.22 (50% Fibonacci retracement, rising trend line). Confirmation of a break below this barrier on a daily closing basis opens the door for a test of the 61.8% levelat 45.33. Alternatively, a turn back above support-turned-resistance at 49.11, the 38.2% Fib, targets the 23.6% retracementat 51.44.
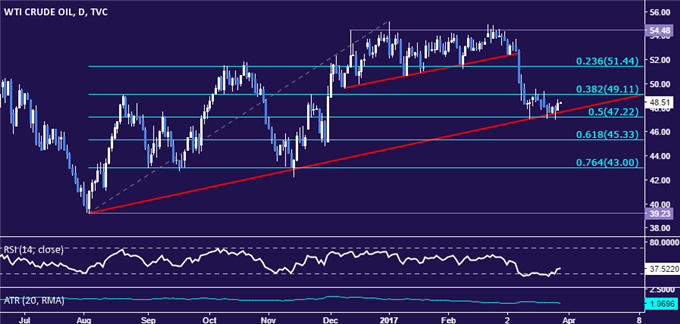
Chart created using TradingView
Disclosure: Are retail traders buying or selling the US Dollar, and what does say about the trend more


