
Gold Price Is Facing Triangle Pattern Resistance
XAU/USD is facing the resistance of the upper trend line (now at around 1343.00) of the triangle pattern on its weekly chart once again. Being contained by the trend line, the gold price pulled back from 1344.65.
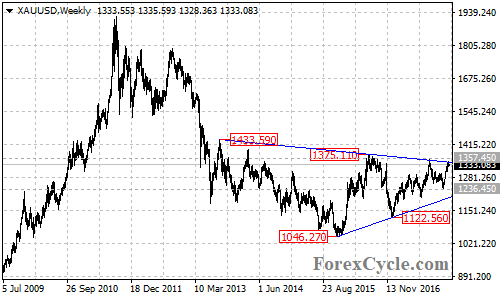
XAU/USD Weekly Chart
Let’s look into the 4-hour chart, the fall from 1344.65 is likely consolidation of the uptrend from 1236.45. Deeper decline towards 1305.82 key support would likely be seen in the coming days. As long as this level holds, the uptrend could be expected to resume and another rise is still possible after the consolidation.
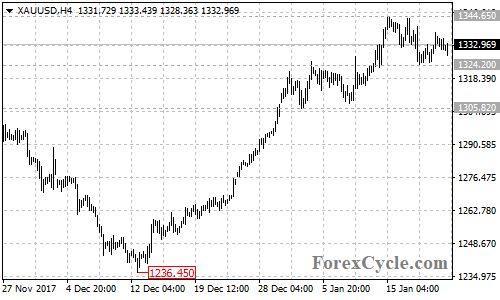
XAU/USD 4-Hour Chart
A breakout of 1344.65 resistance could bring price to next resistance level at 1357.45. Above this level could trigger further upside movement towards 1375.11, followed by 1433.59.
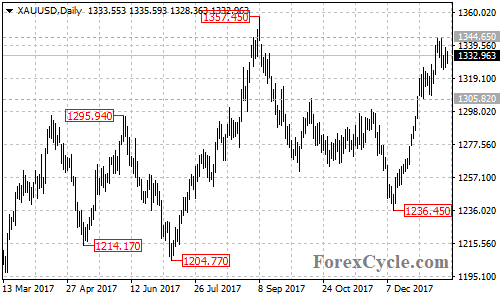
XAU/USD Daily Chart
Near-term support is at 1324.20. A breakdown below this level could bring price back to test the key support at 1305.82. Only breakthrough this level will indicate that the upside movement from 1236.45 had completed at 1344.65 already and lengthier sideways movement in the triangle pattern is underway, then the following downside movement could take price towards the lower trend line of the triangle pattern now at around 1205.
Technical levels
Support levels: 1324.20, 1305.82, 1236.45, 1205.00.
Resistance levels: 1344.65, 1357.45, 1375.11, 1433.59.


