
Gold Miners In 2017 Whipsaw
Ever since 2012’s failure of the ‘QE 3 rally’ in the precious metals it has not been fruitful to micro manage the gold sector, because that failure jump started a savage bear market that would need time to work out the excesses both in the sector’s investor base and in its mining businesses, which had become bloated and inefficient. That’s what bear markets do; they clean out the landscape to make it inhabitable for new investors one day. Here is a weekly chart showing the bear’s kickoff. HUI’s 55 week EMA then became the ball and chain that kept its fate sealed (red arrows) until January of 2016.

In anticipating the next bull phase, we use several different charts (daily, weekly, monthly) and macro indicators (like the components of the Macrocosm to gauge the process (see this post from February 2016 for a look at how the Macrocosm’s planets were aligned at the beginning of the last significant bull phase).

Daily charts have not yet triggered the all clear, the monthly chart is constructive and the weekly chart below shows HUI still underneath the EMA 55. Ever since the correction that began in the summer of 2016 however, the index has been in a whipsaw battle with this key moving average. Traders probably love this, but those trying to confirm a new bull trend (not to mention a bear resumption) have been frustrated. Adding more weight to the EMA 55’s resistance is the fact that this area is also a neckline to a bearish pattern (as highlighted).
The bulls do have a hit of the 62% Fib retrace in December of 2016 going for them, although as long as HUI remains below the EMA 55 (198.73) a possibility of a test of the December 2016 low (or possibly even lower) remains in play. What would break the whipsaw’s grip? A break to the upside and a clearing of the April and February highs.
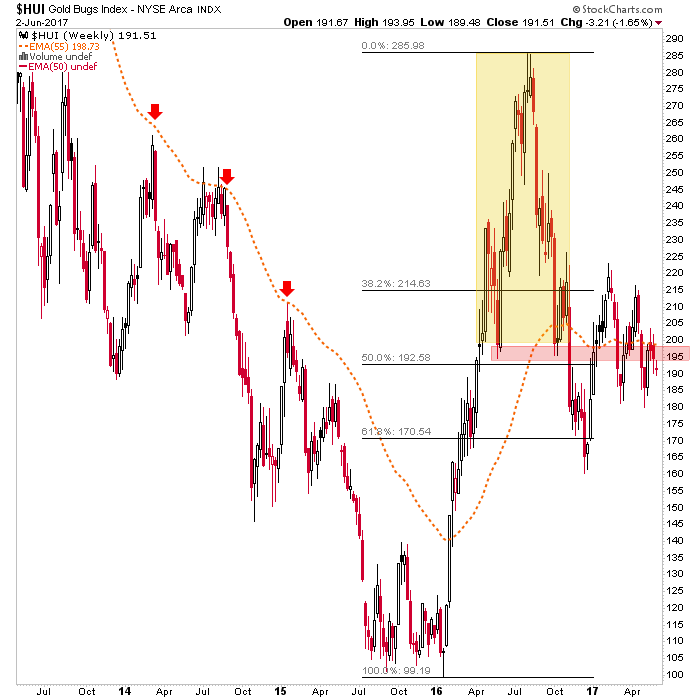
By other work we are doing, May’s monthly close was an important boost for the bullish case (ref. the above-linked post for the monthly chart). But a monthly chart is tricky; what matters is the monthly close, so understand that June could include a whole lot of whipsaw and still end up constructive. The technicals are what they are and on the index, they are not yet bullish and indeed, lean bearish below the EMA 55.
But the sector as a whole is diverged by some relative quality companies, large and small. Larger royalties and miners like Royal Gold, Franco Nevada, Randgold Resources and smaller ones like Wesdome, Kirkland Lake and Sabina seem to be making an early bullish call on the sector.
But first the technical struggle with HUI’s weekly EMA 55 (among a range of other technical parameters) and the fundamental struggle with the Macrocosm (with gold vs. commodities generally looking constructive, but important items like the stock market’s persistent strength and the still okay economy remaining important holdouts to the bull case).
Of course the 1999-2001 time frame, which we are using as a ‘comp’ to the current situation, featured a booming economy… until it no longer boomed, and a booming stock market… until it blew out (Nasdaq) and finally rolled over (Dow and S&P 500).
So be patient gold bugs. Tune out the perma-pom pom promoters and do good, diligent work and things may well set up just fine and one day, much better than fine. Meanwhile, with literally a world of bulling stock markets, bearish commodities and a bond market that is soon to set up an opposite contrarian situation to the one we began highlighting in December, I plan to make sure NFTRH is continually on the job sorting things out rationally, as we have been doing for years, over the various cycles.
Subscribe to NFTRH Premium for your 40-55 page weekly report, interim updates and NFTRH+ chart and trade ideas ...
more

