
Gold Elliott Wave Intraday Analysis
Hello fellow traders. In this blog we’re going to take a look at Gold elliott wave chart and explain the structure in a few sentences. Before we explain current price action, we’re going to take a quick look at the 02/24 chart. As you might remember, in our last blog “ Gold Elliott wave Zigzag pattern” we forecasted a pull back from the 1257.77-1267.70 area.
Gold H1 chart 02/24
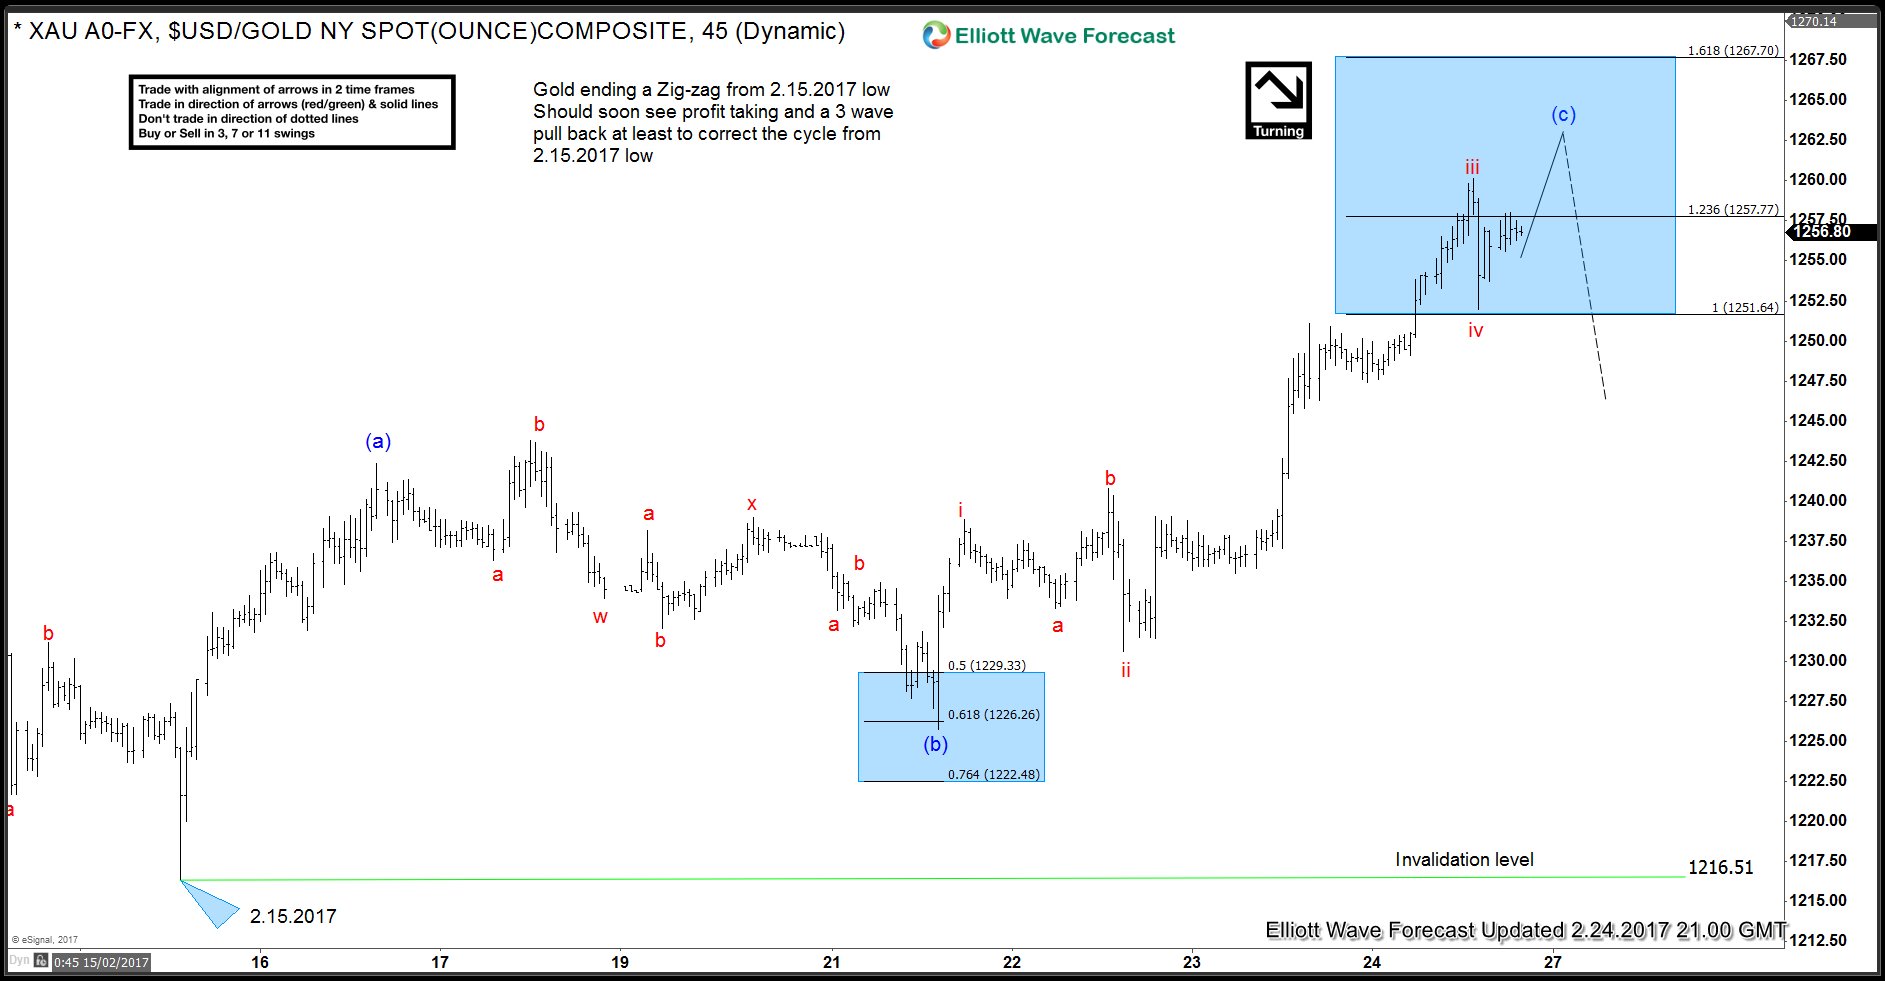
Eventually, we got the last push up in wave v red of (c) and complete Zig Zag Pattern within proposed blue box at 1263.78 high.
Now, let’s take a look at the current price and explain the structure.
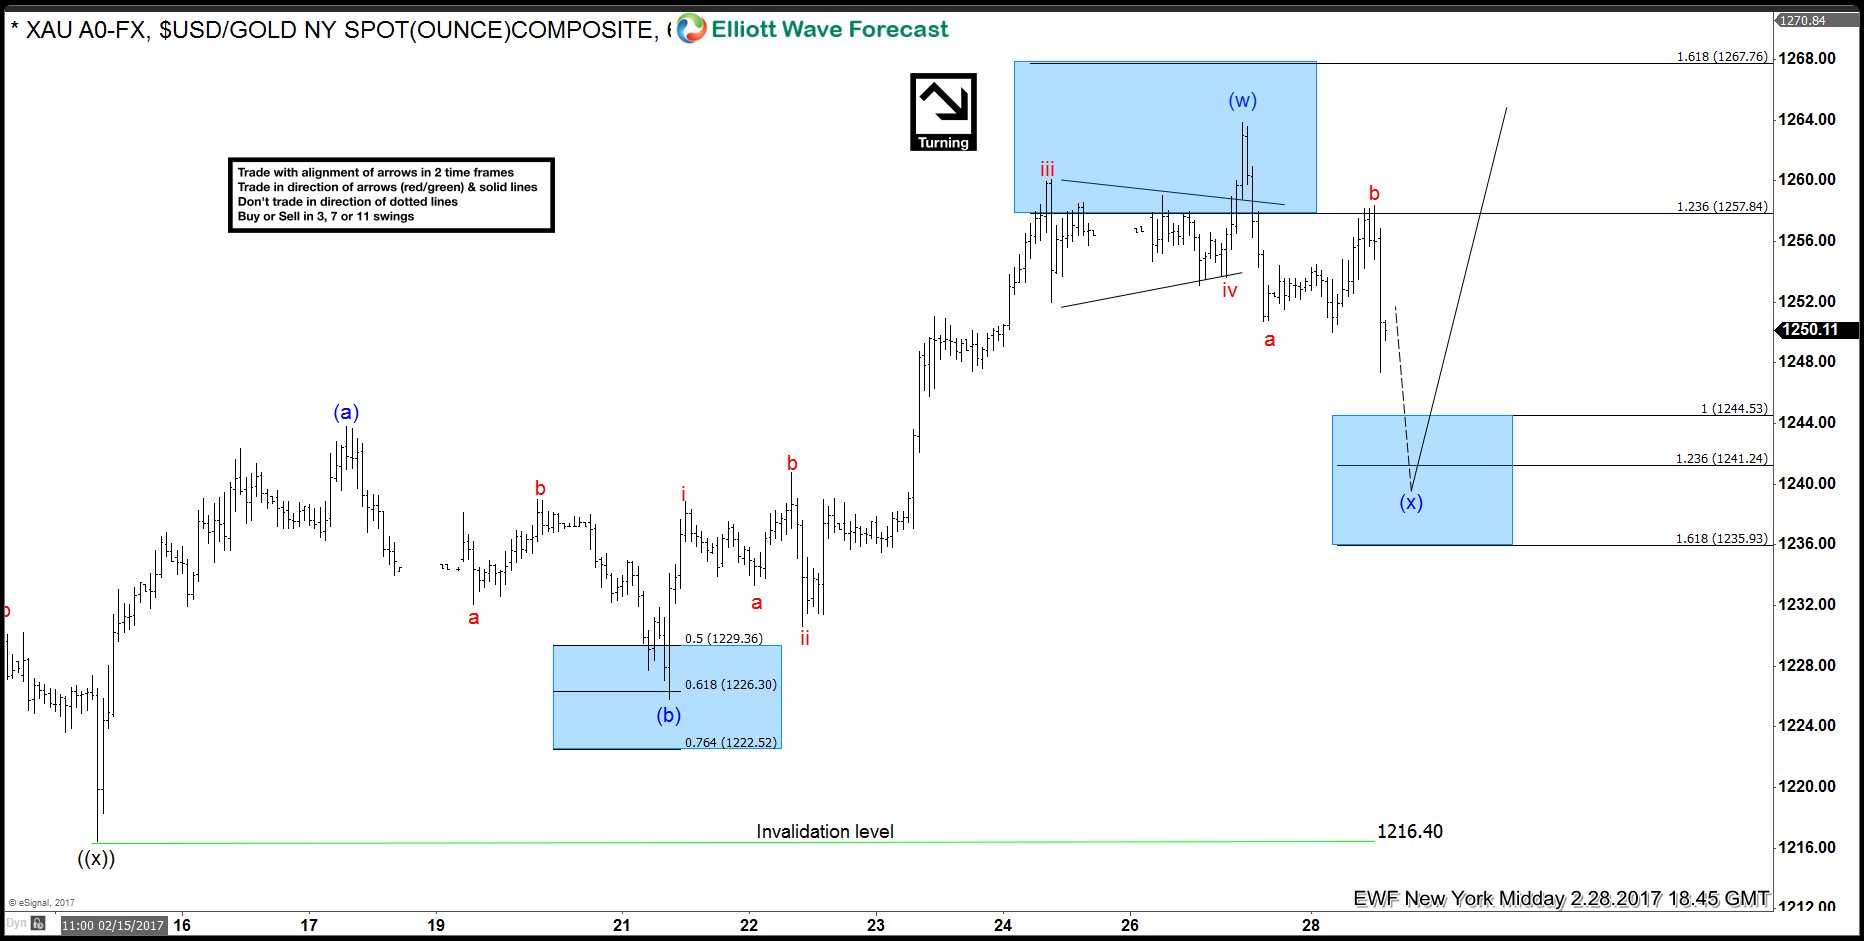
Gold H1 chart 02/28
As we can see the price is correcting the cycle from the 1216.4 low. Current price structure is showing incomplete 3 swings from the 1263.78 peak. Consequently, while below 1258.3 we can see another swing toward technical area :1244.53-1235.93. At above mentioned area, Gold could complete the entire wave ( x) pull back or just the first leg of wave (x). In other words, it could go to new highs from the mentioned area or bounce in 3 waves to fail against 1263.78 peak and do another 3 swings lower to do a double three structure in wave ( x). In either case, a 3 wave bounce at least is expected from the blue box.
Disclosure: None.


