
Gold Cycle Model Chart - Monday, June 25
2018.06.22 Gold Cycle Model Chart
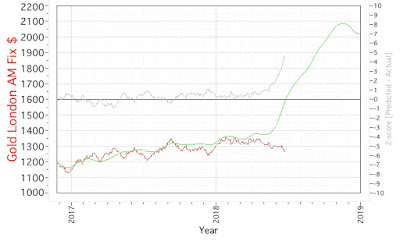
The right phase shift continues, and I suspect that it may continue for several months. This is due to a model error in both cycle length and phase for several decadal cycles at play during this time. The model does suggest that much lower prices for the gold fix are highly unlikely going forwards, but that the longer term basing at ~$1300 +/- 20% can be extended. Extrapolating the model error as noted by the Z-score, I will hazard a guess that the right phase shift will end in the October and November 2018 time frame and either the model dies, or the price does begin to more closely match model prediction.
Disclosure: None
How did you like this article? Let us know so we can better customize your reading experience.

Comments
Leave a comment to automatically be entered into
our contest to win a free Echo Show.

