
GDX Put-Call Chart
From time to time we track the put-call ratios for GDX, GLD and SLV. The put-ratios for GLD and SLV gave good timing signals in 2015. GDX’s signals are a bit more tricky and we have not paid much attention to them.
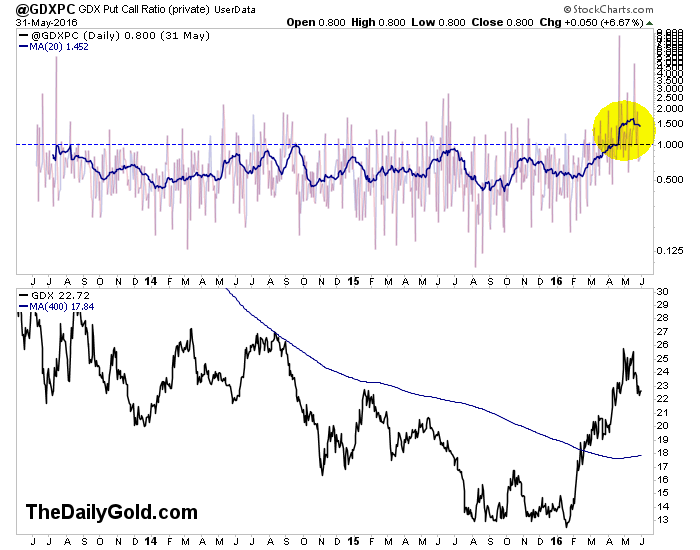
The chart below plots GDX’s put-call ratio, smoothed by a 20-day moving average (blue). As gold stocks emerged from the January bottom options traders met the rebound with skepticism and all the way into May. Note the 20-dma was contained at 1.00 for several years until recent months. From the standpoint of a bull, it is good (in the big picture) to see this skepticism.
Disclosure: None.
As we navigate the end of this bear market, consider learning more about our premium service including our favorite junior ...
more
How did you like this article? Let us know so we can better customize your reading experience.


Need some more analysis
For what?
It would help me to understand the meaning of the chart if I could get further interpretation. Just thought it was too abbreviated