
GDX Daily Chart Update
Last week we had a couple looks at the GDX daily situation, first quieting the hype about the “superb” GDX and its “bull wedge in play” and then updating its progress as it hit the top of the downtrend channel and recoiled.
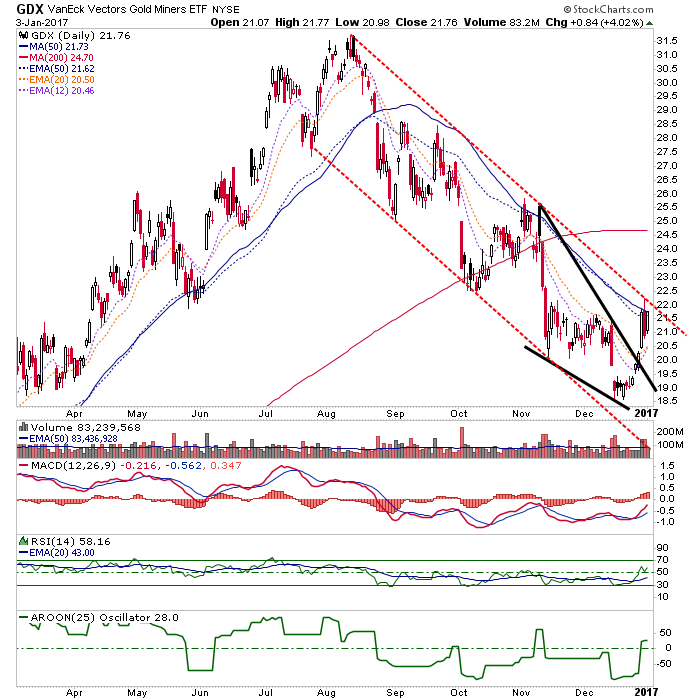
After a happy Tuesday, GDX finds itself still in the game from a bounce perspective and indeed has a constructive looking RSI and fledgling AROON ‘trend up’ signal; but that is superseded by the downtrend channel, the 50 day moving averages and ultimately, the 200 day moving average and finally, the November highs. Short of a rise above the November highs, the question is how strong will the bounce be because until it hits 26, it would still be in ‘lower high’ territory.
Yet in NFTRH 428 we opened up a view of a bottom in gold (likely in January), which was the product of two completely different data points giving the same message, and we raised the short-term outlook to neutral and noted a bullish risk vs. reward in the precious metals (which simply means that upside potential now outweighs downside potential).
As for GDX at this moment however, it is clear that this is still just a bounce, technically.
Disclosure: Subscribe to more


