
For Gold 'Tis Not The Season To Be Jolly"

While December finds Santa scurrying around the world with his toy sack, this month in recent years has found Gold at best a sad sack. Save for a bare monthly gain in 2014, the past seven years for Gold have decidedly sported December downers. Here are the daily trade tracks of Gold's cumulative percentage change for each December from 2011 though 2017, (the latter being this month-to-date):

Clearly there's no reason why this December ought be any different than down:
- Come this Wednesday (13 December) the Federal Open Market Committee shall vote to shift their bank's funds rate up to a targeted 1.25%-1.50% range. Conventional wisdom declares that is a Gold negative, (albeit you and I provably know better, given the 2004-to-2006 increase in the Fed funds rate from 1% to 5%, Gold rising during the same stint by better than 50%);
- The FOMC has also initiated its "balance sheet normalization program", the baby-step approach to withdrawing financial system liquidity having begun in October. Conventional wisdom declares that is a Gold negative, (albeit you and I provably know better, given that the U.S. money supply as measured via "M2" has actually increased October-to-date by $126 billion);
- The stock market is in full euphoric soar, the S&P 500 year-to-date now up 18.4%. Conventional wisdom declares that is a Gold negative, (albeit you and I provably know better, given that both the S&P and Gold have together recorded net annual gains in 10 of the past 15 years).
And yet through it all, you and I also provably know that Gold is trading at half its currency debasement value while the S&P is at double its earning support. Visions of sugar plums dance in their heads, but in the midnight depths of our downy pillows we dream of means regression instead.
And thus as the Great Waiting Game trudges forth, we find Gold -- at one point up 18.3% in 2017 just shy of Base Camp 1377 at 1362 exactly three months ago on 08 September -- now year-to-date up only 8.6% in settling the week yesterday (Friday) at 1251, more than 100 points off that high. So in terms of Gold's weekly bars, where does that put us?
"Back in The Box."
Gold similarly seems to have leapt from a plane at 1280 to float down through this past week toward terra firma near the bottom of The Box (1280-1240). Let's just hope the landing sticks within the purple lines:

Speaking of sticks, Gold now at 1251 is stuck right on its 300-day moving average, which itself is in decline per the next graphic's bright blue line. The phrase from last week's missive that "...our technical read for Gold and Silver would suggest some selling into year-end..." clearly is playing out. Yet we again point out that rightward from the chart's midpoint, the broad picture remains more consolidative than negative, as like a long-running Broadway show, "Gold Forever 1200" continues to go:

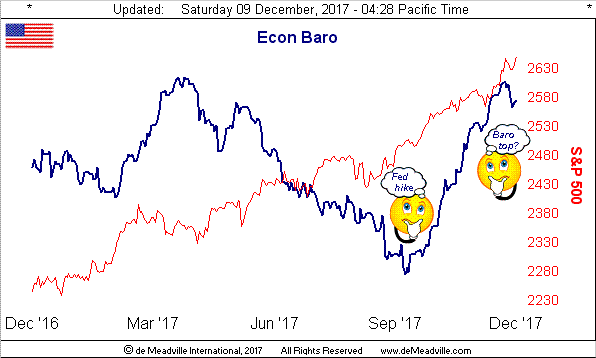
Now with the new week in the minds of the FinMedia being "Nothing but Fed", (as there is also quite a bevy of other incoming EconData on the docket), let's take a gander at the Economic Barometer. Look at its blue line: topping? 'It's often said that it is "behind the curve", our Fed. To be sure, this past week the Bureau of Labor Statistics posted welcome payrolls data, although its growth slowed, as did that from ADP's numbers. The services component from the Institute for Supply Management fell from the 60s into the 50s. Unit Labor costs for Q3 were revised from an inflationary +0.5% to a deflationary -0.2%. And the trade deficit rose to its largest imbalance since May 2015. Is therefore the Fed in its typical timing about to pull the rate hike trigger at an Econ Baro top? Something upon which to ponder...
Further, should the Fed's hike coincide with the end of Baro's upward ride, we ought see a flow of funds to Gold's side. And just as has Gold experienced so many lousy Decembers in recent years, it has had but one losing January (2013) in the last six. Buy the December Dip to ascend on the January Trip?
The following two-panel graphic may help us get a grip. Here we've the daily bars of Gold on the left and Silver on the right for the past three months-to-date. Their respective "Baby Blues" of 21-day linear regression trend consistency are in full dive, with Sister Silver continuing as the negative pathway leader, she actually now being net down for the year by 9¢ at 15.87 vs. 2016's final settle at 15.96.

Next in drilling down to the 10-day Market Profiles for Gold (left) and Silver (right), "down" is the operative word, both precious metals sporting an array of overhead trading resistors with which to cope at least near-term:

So at the end of the day, indeed as we glide down through December into the end of the year, we'd like to see Gold finish at worst inside The Box (1280-1240), which admittedly at this writing with three trading weeks in the balance looks to be challenging. Hardly jolly, that. Still, believers in The Box can belly up to the Gold bar and bolster price straight away, else face buying lower another day. Which in itself is hardly a bad thing considering Gold's true monetary value today, (our Scoreboard estimate presently at 2774 vs. price at 1251).
Regardless, it beats paying $118,000 for a digital kitty.
Disclaimer: If ever a website needed a Disclaimer, this is it. Indeed, your very presence at any page within this Domain which is www.deMeadville.com has already bound you in the ...
more

