
Don’t Miss This Important Signal!
It is generally agreed that in a Gold Bull Market, the gold producers lead the way, by outperforming gold bullion. To examine this trend we visit Stockcharts.com and pull up a chart that compares mining stocks (GDX) to gold bullion (GLD).
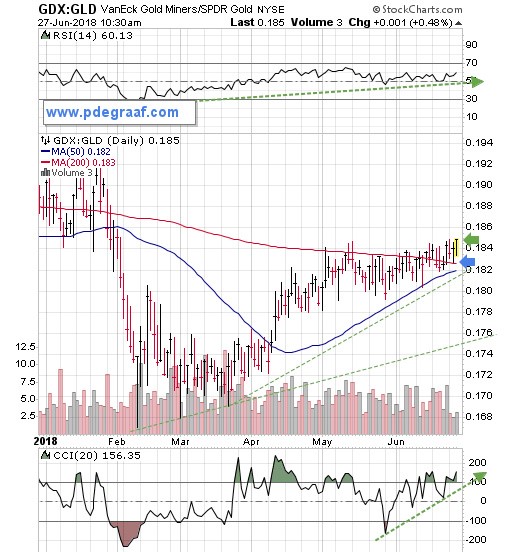
This index bottomed in March and since then the miners have moved ahead of gold bullion. The first hurdle, at the 50DMA (blue line) was overcome in April. The next hurdle, at the 200DMA (red line), took several months, but it is now in the process of being ‘put in the rear view mirror’. The blue arrow points to the fact that for the past three days the daily range has been above the resistance. The supporting indicators (top and bottom of chart), are positive. A rise above the green arrow will convince a lot of investors that the gold sector is ‘the place to be’. The timing is likely to coincide with the resumption of trading, after the US July 4th Independence Day Holiday.
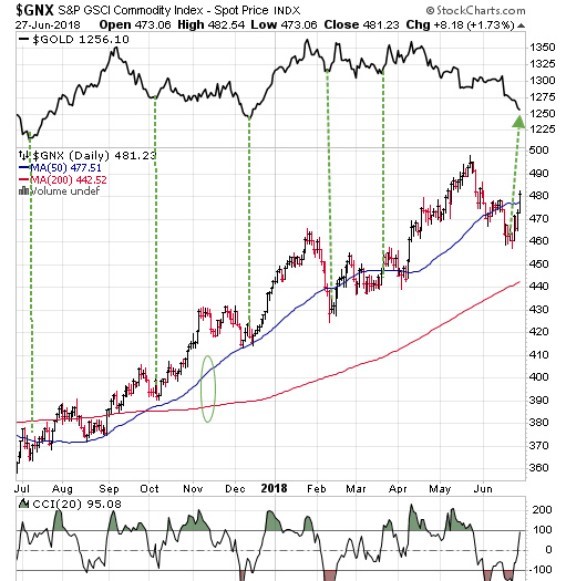
Featured is GNX the commodities index, with the gold price at the top. The green lines show the correlation between bottoms in this index and gold. A turnaround in gold is overdue.
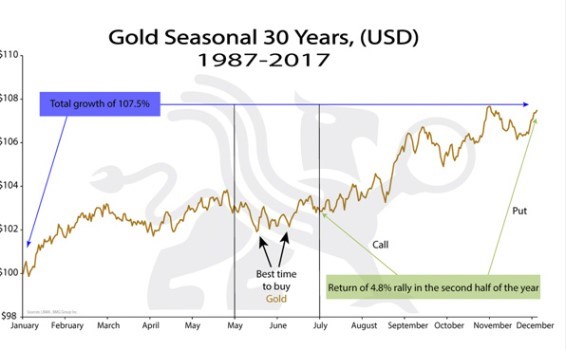
This chart courtesy BMGbullionfunds.com shows June is a good time to buy gold and gold stocks.
Disclaimer: Investing involves risk taking. Please do your own due diligence. Peter Degraaf is NOT responsible for your trading decisions.
Peter Degraaf is a stocks and commodities investor with ...
more

