
Crude Prices Flirt With Key Resistance- 2017 Opening Range Intact
Crude Weekly
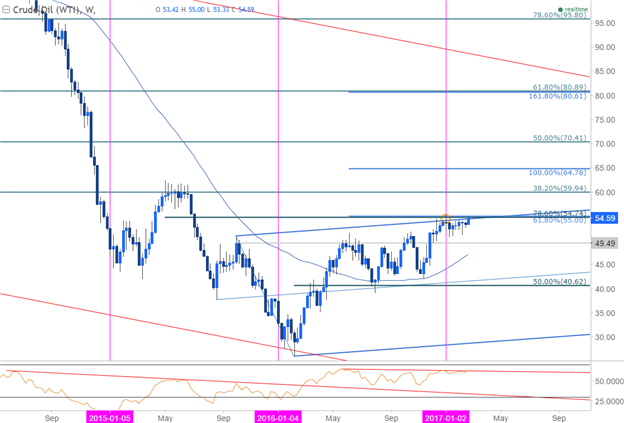
Technical Outlook: Crude prices are once again probing a critical resistance range tested earlier this year at 54.74- 55- this region is defined the 78.6% retracement of the decline off the 2015 high & the 61.8% extension of the advance off the 2016 low and converge on the upper median-line parallel of the 2015 ascending pitchfork. Note that this level also marks the yearly opening range high. The immediate advance remains at risk while below this threshold and likewise, a weekly close above would suggest a more meaningful advance is underway.
Crude Daily
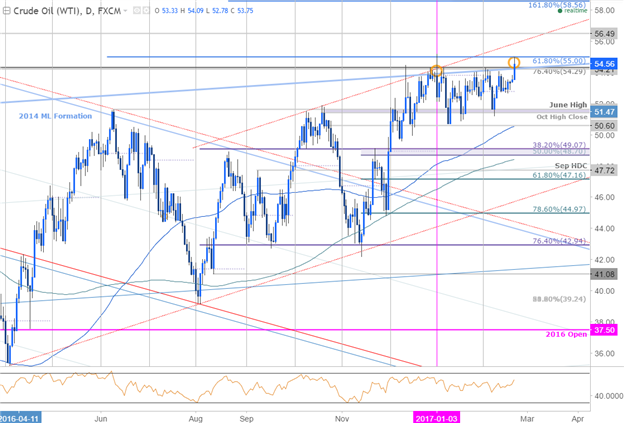
Notes: A closer look at the daily chart sees today’s high registering precisely at the 61.8% extension and while it’s still too early to tell if this resistance barrier will hold, the advance remains at risk while below. Look for an initial move / close below 54.29 to mark the onset of a pullback with a break below the monthly open at 52.78 needed to shift the focus back towards the range lows- such a scenario would eyes subsequent objectives at 51.40/64 & key support into 50.60.
Keep in mind that large speculators continue to hold record long positioning since January and with the market so heavily weighted, the washout could be rather vicious. That said, a breach above the 55-handle still has to contend with near-term targets at channel resistance (currently ~55.85) and the 2015 May low at 56.49 – If reached would also be an area of interest for exhaustion / short-entries.


