Tuesday, April 25, 2017 5:50 AM EDT
Crude oil prices continued to decline, dropping to the lowest level in a month. A standout catalyst explaining intraday losses was not readily apparent but the broader narrative making the rounds on the newswires pointed to concerns about the inability of OPEC output cuts to boost prices in the face of swelling swing supply.
Sellers’ resolve will be tested as API inventory flow data crosses the wires in the hours ahead. Official EIA figures due the following day are expected to show a 1.6 million barrel drawdown. An API number that falls short of that may produce another down day whereas a larger outflow may offer prices a lifeline.
Gold prices remained on the defensive having dropped after the first-round vote in the French presidential election. European shares have picked up on a positive lead from Asia, pushing bond yields higher and pressuring the yellow metal further. S&P 500 futures hint at more of the same as Wall Street comes online.
The move lower may be capped if US economic data pours cold water on rate hike bets however. New home sales and consumer confidence report are on tap, with weakening expected on both fronts. US data outcomes have deteriorated relative to forecasts in recent weeks, warning of elevated downside surprise risk.
GOLD TECHNICAL ANALYSIS – A close below trend line support the move higher since mid-March suggests long-term downtrend resumption may be at hand after gold prices topped below the $1300/oz figure, as expected. From here, a daily close below the 14.6% Fibonacci expansion at 1258.62 exposes the 1235.91-41.50 area (October 7 2016 low, 23.6% level). Alternatively, a push above falling trend line resistance at 1287.46 opens the door for a test of the 1295.46-1308.00 region (April 17 high, support-turned-resistance).
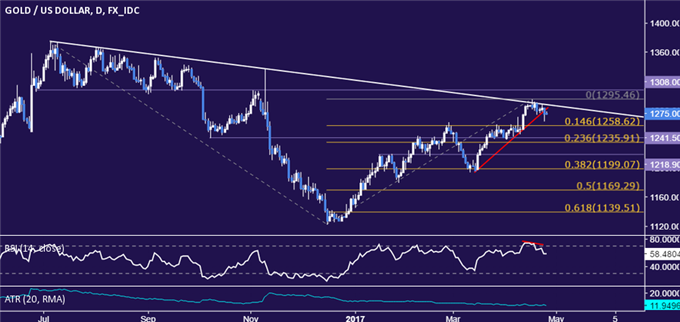
Chart created using TradingView
CRUDE OIL TECHNICAL ANALYSIS – A seventh consecutive daily drop has given crude oil prices their worst losing streak in over a year. From here, a daily close below the 48.56-85 area (trend line, 61.8% Fibonacci expansion) paves the way for a test of the 47.08-69 zone (March 22 low, 76.4% level). Alternatively, a reversal above the 50% Fib at 49.78 exposes the 38.2% expansion at 50.71.
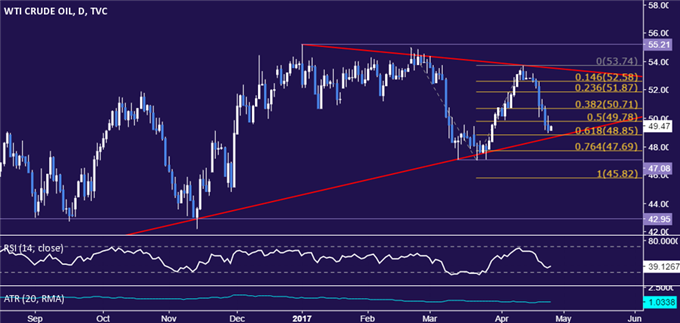
Chart created using TradingView
Disclosure: Have a question about trading the US Dollar?
more
Disclosure: Have a question about trading the US Dollar? Join a Q&A webinar and ask it live!
If you’re looking for trading ideas, check out our Trading Guides. And if you’re looking for ideas that are more short-term in nature, please check out our IG Client Sentiment
Paul conducts webinars geared towards equity indices and commodities every Tuesday, for details see the Webinar Calendar
Join me on Mondays at 7:30 EDT/11:30 GMT for the FX Week Ahead webinar, where we discuss top event risk over the coming days and strategies for trading FX markets around the events listed below. What will drive the US Dollar trends through June? See our forecast to find out!
Are retail traders buying or selling the US Dollar, and what does say about the trend? Find out here! DailyFX, the free news and research website of leading forex and CFD broker FXCM, delivers up-to-date analysis of the fundamental and technical influences driving the currency and commodity markets. With nine internationally-based analysts publishing over 30 articles and producing 5 video news updates daily, DailyFX offers in-depth coverage of price action, predictions of likely market moves, and exhaustive interpretations of salient economic and political developments. DailyFX is also home to one of the most powerful economic calendars available on the web, complete with advanced sorting capabilities, detailed descriptions of upcoming events on the economic docket, and projections of how economic report data will impact the markets. Combined with the free charts and live rate updates featured on DailyFX, the DailyFX economic calendar is an invaluable resource for traders who heavily rely on the news for their trading strategies. Additionally, DailyFX serves as a portal to one the most vibrant online discussion forums in the forex trading community. Avoiding market noise and the irrelevant personal commentary that plague many forex blogs and forums, the DailyFX Forum has established a reputation as being a place where real traders go to talk about serious trading.
Any opinions, news, research, analyses, prices, or other information contained on dailyfx.com are provided as general market commentary, and does not constitute investment advice. Dailyfx will not accept liability for any loss or damage, including without limitation to, any loss of profit, which may arise directly or indirectly from use of or reliance on such information.
less
How did you like this article? Let us know so we can better customize your reading experience.


