
Cotton Chart
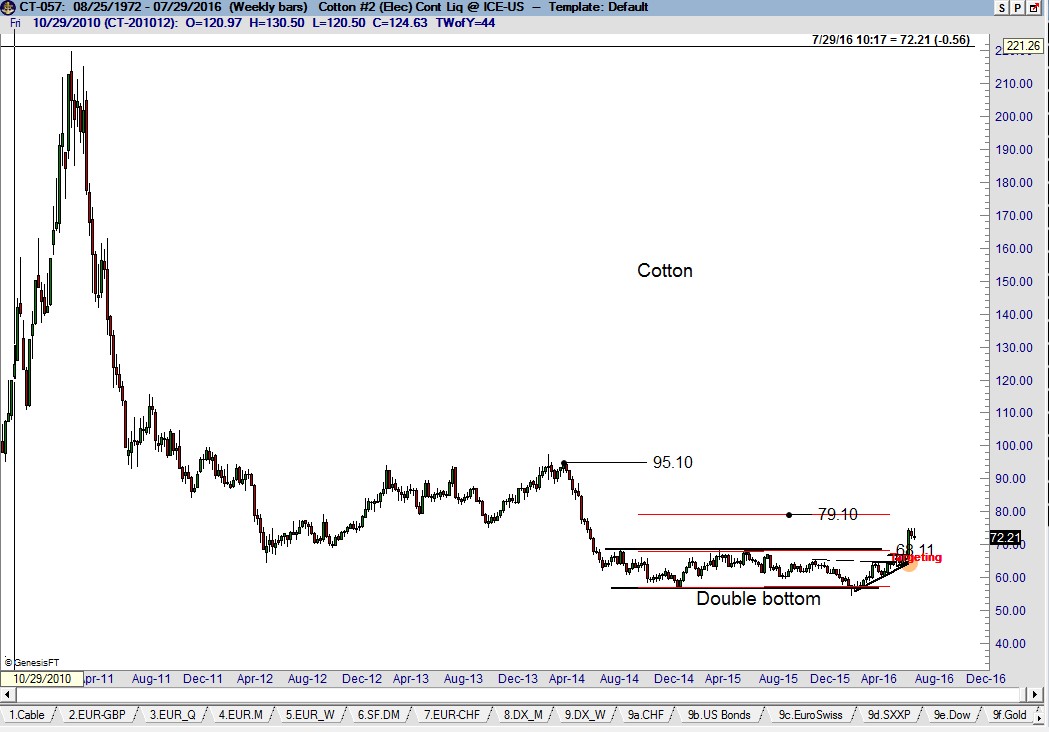
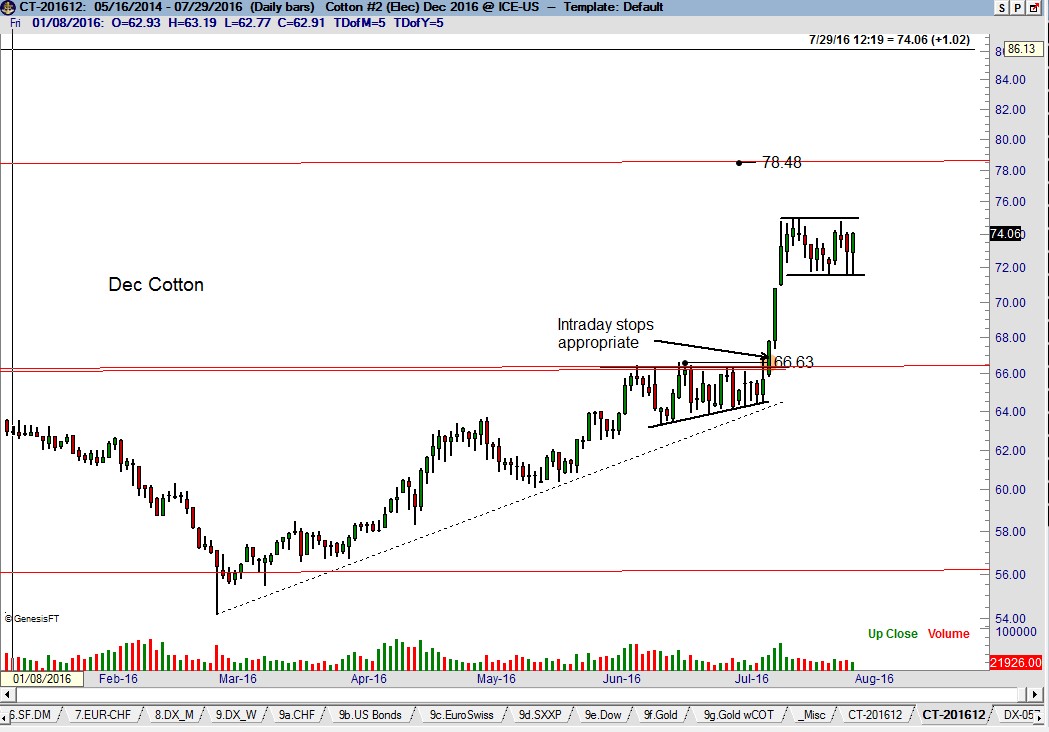
The dominant construction on the Cotton Chart continues to be the completed 24-month double bottom on the weekly Cotton Chart. The targets of this bottom are 79.10 (the measured move) and 95.10 (May 2014 high). The Dec contract was launched by a 5- week pennant. Factor is long, having taken partial profits.
Cotton Chart – The market appears to be forming a small 2-week pennant – I am willing to increase my leverage based on this pattern. However, a longer period of congestion or even a sizable correction would be very normal given the magnitude of the Jul 11-13 advance. A decline back toward 71.00 to fill the Jul 13 gap cannot be ruled out. There is no reason at this time to believe the period since the Jul 13 high will become part of a topping pattern.
Factor Membership is now available, including a quarterly option. You could consider your membership in the Factor ...
more

