
CoT, Positions For This Week
Following futures positions of non-commercials are as of August 28, 2018.
10-year note: Currently net short 529.8k, down 170.7k.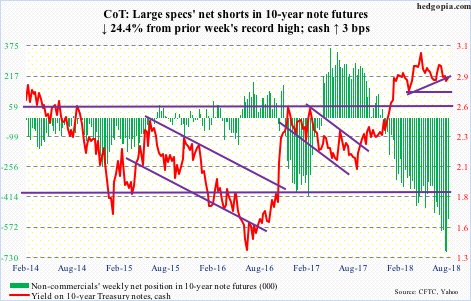
July’s core PCE (personal consumption expenditures) – the Fed’s favorite measure of consumer inflation – was reported Thursday. Inflation perked up 1.98 percent year-over-year, up from 1.92 percent in June. The Fed has a two-percent inflation target. July’s was the fastest growth rate since inflation rose 2.04 percent in April 2012. Yet, the 10-year Treasury rate (2.85 percent) shed two basis points in that session to 2.86 percent. Both core PCE and core CPI (consumer price index) have been trending higher since last September. The bond market only yawns.
This is not the scenario non-commercials who cut back this week but are still massively net short 10-year note futures were perhaps imagining. More so because the recent uptrend in inflation also accompanies strength in other macro data, including GDP. Yet, bond vigilantes act sanguine. Yields did rise to 3.02 percent early August, but that was it, having then dropped to 2.81 percent last week. The risk non-commercials face is when data begin to soften, and it will. After nine years of recovery/expansion post-Great Recession, the current pace of growth is simply unsustainable. This leaves plenty of room for short squeeze down the line.
With this as a backdrop, the neckline of a potentially bearish head-and-shoulders formation on the 10-year breaks around 2.75-2.8 percent. With two-year T-yields at 2.62 percent and a 25-basis-point hike in the fed funds rate later this month imminent, it does not take long for the 10s/2s to invert.
30-year bond: Currently net short 5.7k, down 2.8k.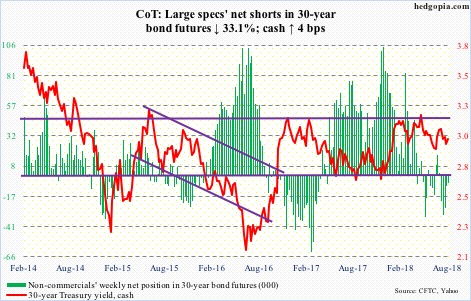
Major economic releases next week are as follows.
Markets are closed Monday for Labor Day.
The ISM manufacturing index for August is due out Tuesday. July contracted 2.1 points month-over-month to 58.1. February’s 60.8 was the highest since May 2004.
Productivity (2Q18) and the ISM non-manufacturing index (August) are on tap for Thursday.
In 1Q18, non-farm output per hour increased 2.9 percent on an annualized basis. This was the fastest growth rate since growing 3.1 percent three years ago.
Services activity in July shrank 3.4 points m/m to 55.7. January’s 59.9 was the highest ever (although data only goes back to January 2008).
Friday brings August’s employment report. The economy produced 157,000 non-farm jobs in July, for a monthly average this year of 215,000. Last year, the monthly average was 182,000. However, average hourly earnings continue to remain subdued, up a measly 2.7 percent y/y in July.
Crude oil: Currently net long 608k, up 17.2k.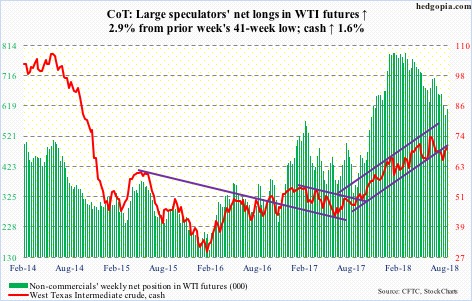
Spot West Texas Intermediate crude ($69.80/barrel) rallied past the 50-day moving average ($69.25) Wednesday. The EIA report for the week of August 24 out that day probably helped trader sentiment.
US stocks of crude, gasoline and distillates all fell – respectively down 2.6 million barrels, 1.6 million barrels and 837,000 to 405.8 million barrels, 232.8 million barrels and 130 million barrels. Crude imports fell 33,000 barrels per day to 7.5 million b/d. Crude production remained unchanged at 11 mb/d. Refinery utilization decreased 1.8 percentage points to 96.3 percent.
This week’s rally past horizontal resistance at $69-69.50 preceded defense of the 200-day mid-August. Bulls also retook a rising trend line from June last year. The risk they face is this. There is a potential head-and-shoulders formation in the making. The right shoulder will be complete if the crude retreats from $72-73, or thereabouts. Thursday, it rallied to $70.50 intraday. The neckline lies around $64, which was defended mid-August.
E-mini S&P 500: Currently net long 144.5k, up 20.3k.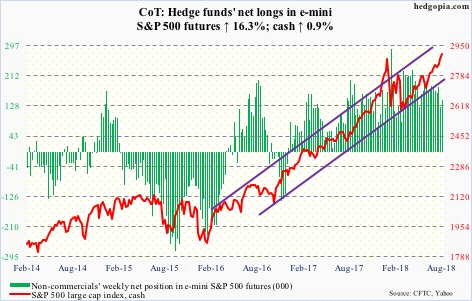
On August 15, bulls defended breakout retest at 2800. Between that intraday low and Wednesday’s high of 2916.50, the cash (2901.52) rallied 4.1 percent. In 11 sessions! That is fast. Several indicators are overbought, including our own Hedgopia Risk Reward Index. Investors Intelligence bulls this week gained 1.9 percentage points to 59.6 – a seven-month high. The NAAIM exposure index jumped 11.84 points to 98.3 – an 11-week high.
Flows are cooperating, though. In the week to Wednesday, SPY (SPDR S&P 500 ETF) took in $931 million, IVV (iShares core S&P 500 ETF) $606 million, while VOO (Vanguard S&P 500 ETF) lost $202 million (courtesy of ETF.com). In the same week, US-based equity funds (including ETF’s) gained $2 billion (courtesy of Lipper.com).
The daily chart is itching to go lower, and it is occurring at a time when momentum indicators are extremely extended. Nearest support lies at 2870s. This will be an important test of the prior high of 2872.87 reached on January 25.
Euro: Currently net short 7.2k, up 2.4k.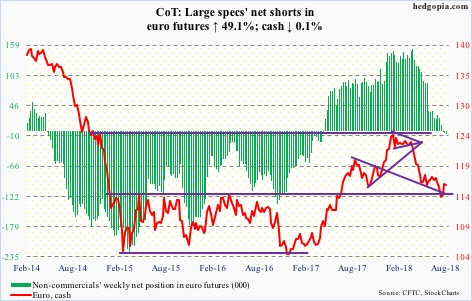
The cash ($116.12) quickly rallied intraday from $113.01 on August 15 to $117.34 this Tuesday – up 3.8 percent in mere 10 sessions. This is huge in the currency land! The Tuesday high also just about the kissed the daily upper Bollinger band. Right there also lied a slightly falling trend line from early June. It was a perfect spot to begin to unwind daily overbought conditions. Worse, $115-plus gets tested. This has proven to be an important level for nearly four years now.
Gold: Currently net short 3.1k, down 5.6k.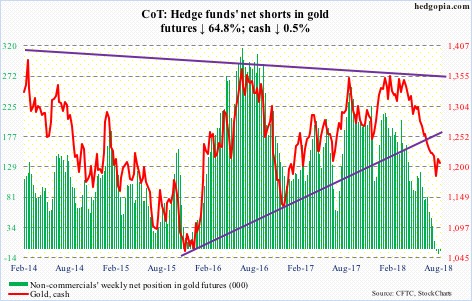
Despite recent improvement in gold’s price action, GLD (SPDR gold ETF) saw no respite in outflows, losing another $340 million in the week through Wednesday. IAU (iShares gold trust) in the same week attracted $83 million – its first positive week in 15. In the last 16, GLD had one positive week, for a cumulative loss of $4.5 billion (courtesy of ETF.com).
For its part, the cash ($1,206.70/ounce) recaptured support-turned-resistance at $1,210-ish, but only briefly. For four months through mid-August, the metal came under tremendous pressure, dropping from $1,369.40 to $1,167.10 intraday. Base-building is not going to be easy, if that is what is transpiring in gold currently. For now, the daily chart is looking to go lower.
Nasdaq 100 index (mini): Currently net long 37.4k, up 6.3k.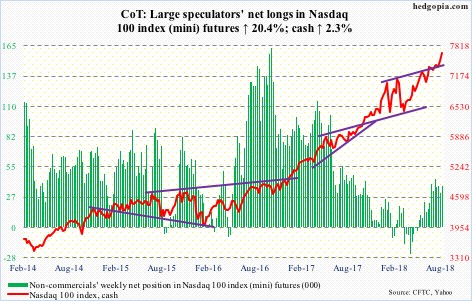
QQQ (Invesco QQQ Trust) gained $535 million in the week ended Wednesday, followed by inflows of $646 million in the prior week. This was the first positive back-to-back weekly flows in the last 13 (courtesy of ETF.com).
The cash (7654.55) began the week with a mini-breakout, rallying past the prior high of 7511.39 from July 25. Shorts likely helped. Daily and weekly momentum indicators are way overbought. Thursday produced a long-legged doji right outside the daily upper Bollinger band, followed by a candle with a little bit of a wick Friday. Near term, bulls would be looking to successfully retest this week’s breakout. There is another important support right underneath – at 7300 – which now also approximates the 50-day (7339.92).
Russell 2000 mini-index: Currently net long 5.8k, up 2.1k.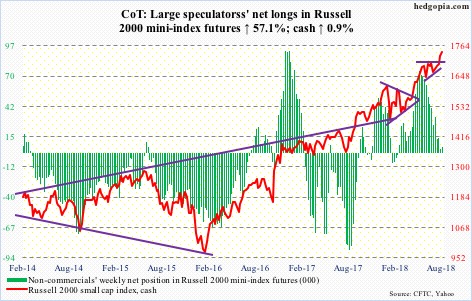
Money continued to flow into small cap-focused ETF’s, with IWM (iShares Russell 2000 ETF) gaining $274 million and IJR (iShares core S&P small-cap ETF) $184 million in the week to Wednesday (courtesy of ETF.com). Last week’s breakout probably did the trick. Tuesday last week, the cash (1740.75) broke out of two-month resistance at 1710-ish. A measured-move target of this breakout lies at 1780s. Friday, the Russell 2000 small cap index rallied to 1742.09 intraday. There are some signs of fatigue. Breakout retest is the path of least resistance near term, with nearest support at 1722.
US Dollar Index: Currently net long 34.6k, up 449.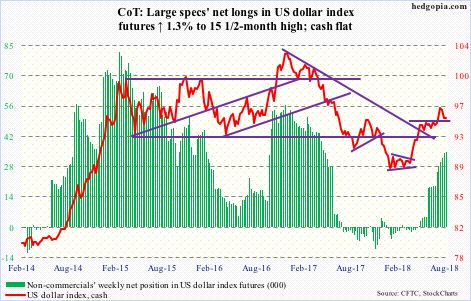
The cash (95.08) has faced pressure since August 15 when it reversed after reaching 96.87 intraday. Monday, bulls lost the 50-day (94.84), which rejected rally attempts in the next three sessions before yielding Friday. The US dollar index essentially closed out the week on support-turned-resistance at 95-plus.
The daily chart is getting oversold, which is an opportunity for dollar bulls to regroup and use Friday’s action to push higher. Next week, if indeed President Trump goes ahead with imposition of tariffs on additional $200 billion in Chinese imports, the greenback likely attracts bids. A failure to do so would mean overbought weekly conditions continue to unwind.
VIX: Currently net short 113.4k, up 11.6k.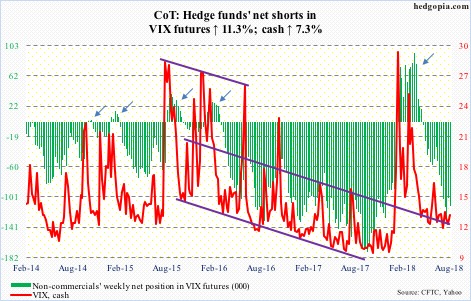
In seven of the past 10 sessions, the CBOE equity-only put-to-call ratio was in the 0.50s, with the other three in the low-0.60s. Consequently, the 10-day average ended the week at 0.573, and the 21-day at 0.607. These are low readings, and reflect built-in optimism among traders.
In the meantime, volatility bulls continued to defend the 11 range on the cash (12.86), which has provided support for nearly four months now. Previously, VIX routinely fell to 10s, even high single digits. Vol bulls should find it encouraging. The problem they are having thus far is that rallies quickly get sold. The latest was on August 15 when VIX rose to 16.86 intraday but only to spike-reverse. In all probability, this listless action eventually resolves to the upside. Among others, the weekly MACD is gradually working on a potentially bullish crossover.
Disclaimer: This article is not intended to be, nor shall it be construed as, investment advice. Neither the information nor any opinion expressed here constitutes an offer to buy or sell any ...
more

