
Copper Shorts Squeezed As The Red Metal Shines
The current bullish trend for copper shows no sign of slowing just yet with the red metal touching a 3 year high largely driven by increasing demand from China, along with a fall in inventories in the London warehouses. On the London Metal Exchange, it touched a high of $6649 tonnes during the week, a level not seen since late 2014. The continued trend higher has also been the result of supply issues globally, and as always when such trends develop, both traders and speculators become increasingly nervous and vexed, as the trend gathers momentum and in sharp contrast to their opinion of what ‘should’ be happening. What ‘should’ be happening is of no consequence to the market whatsoever. This facet of trading behavior is perhaps seen most commonly in the gold market where many participants have a fervent belief that the price of gold should always rise and never fall, no matter the market conditions, sentiment or economic climate. Trading with an opinion about what ‘should’ happen is dangerous in the extreme and the move in copper is generating exactly these reactions as it climbs ever higher. So who’s right, the doubters or the markets?
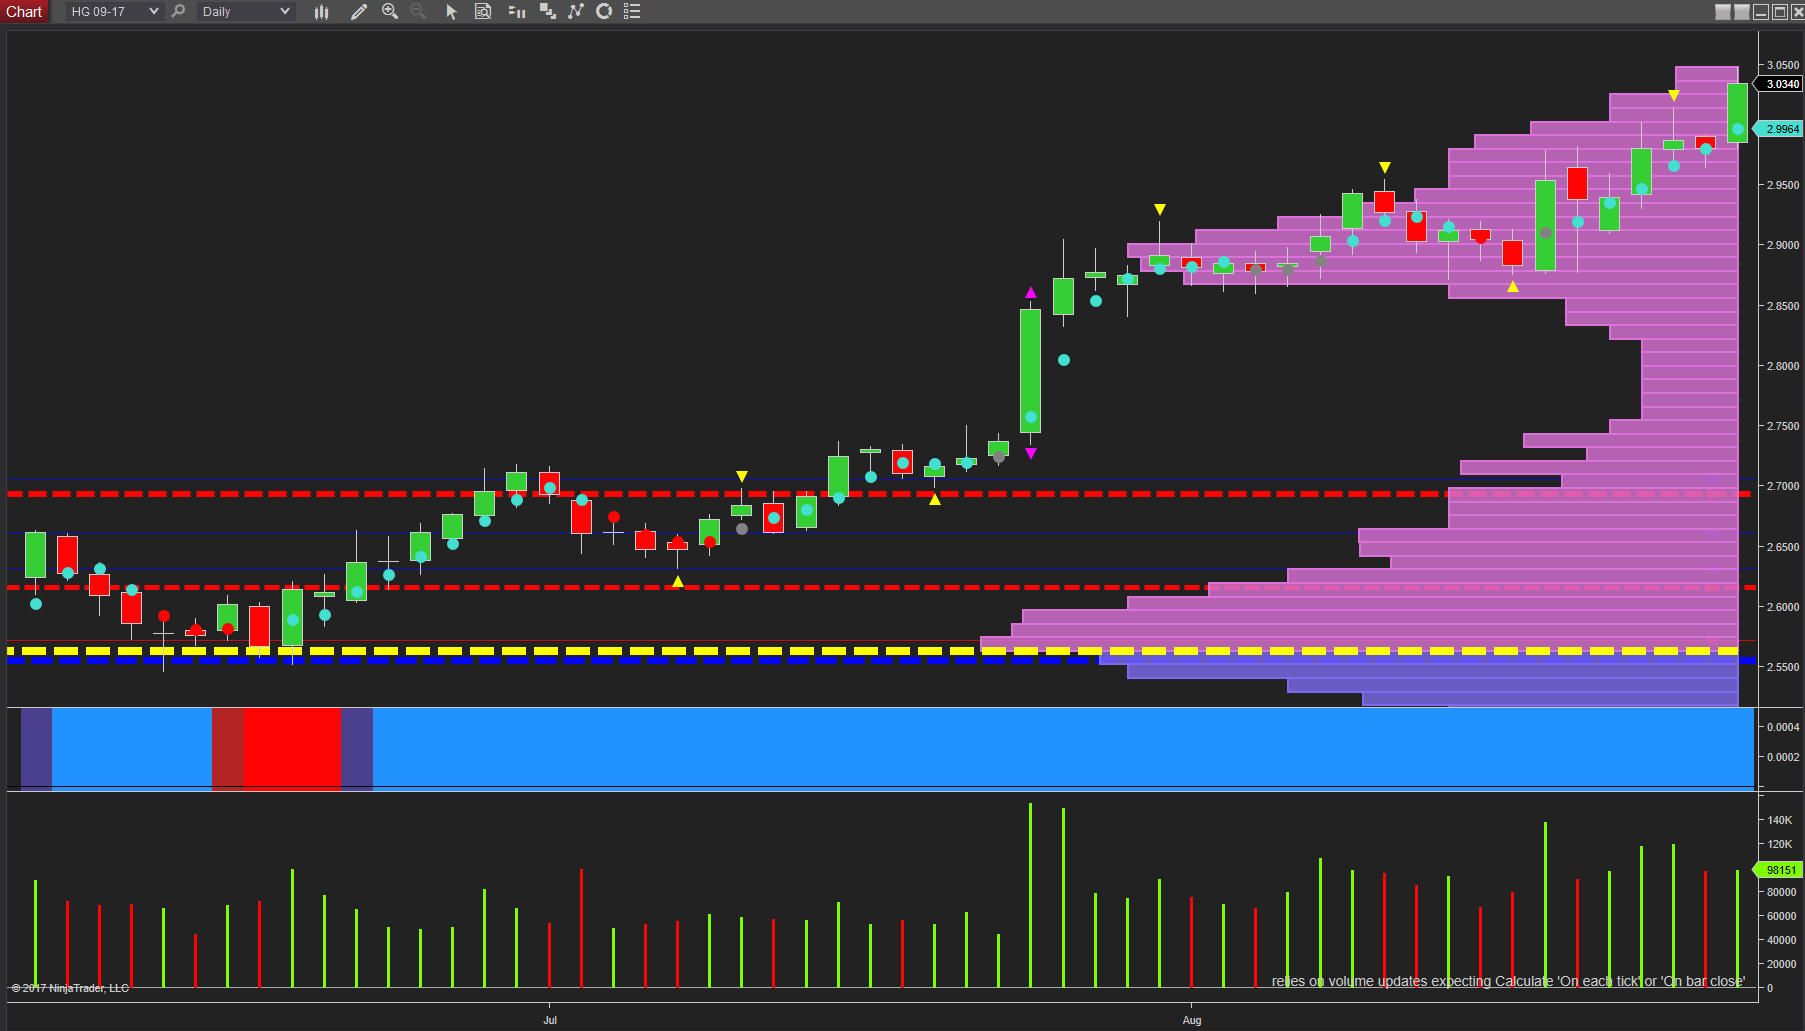
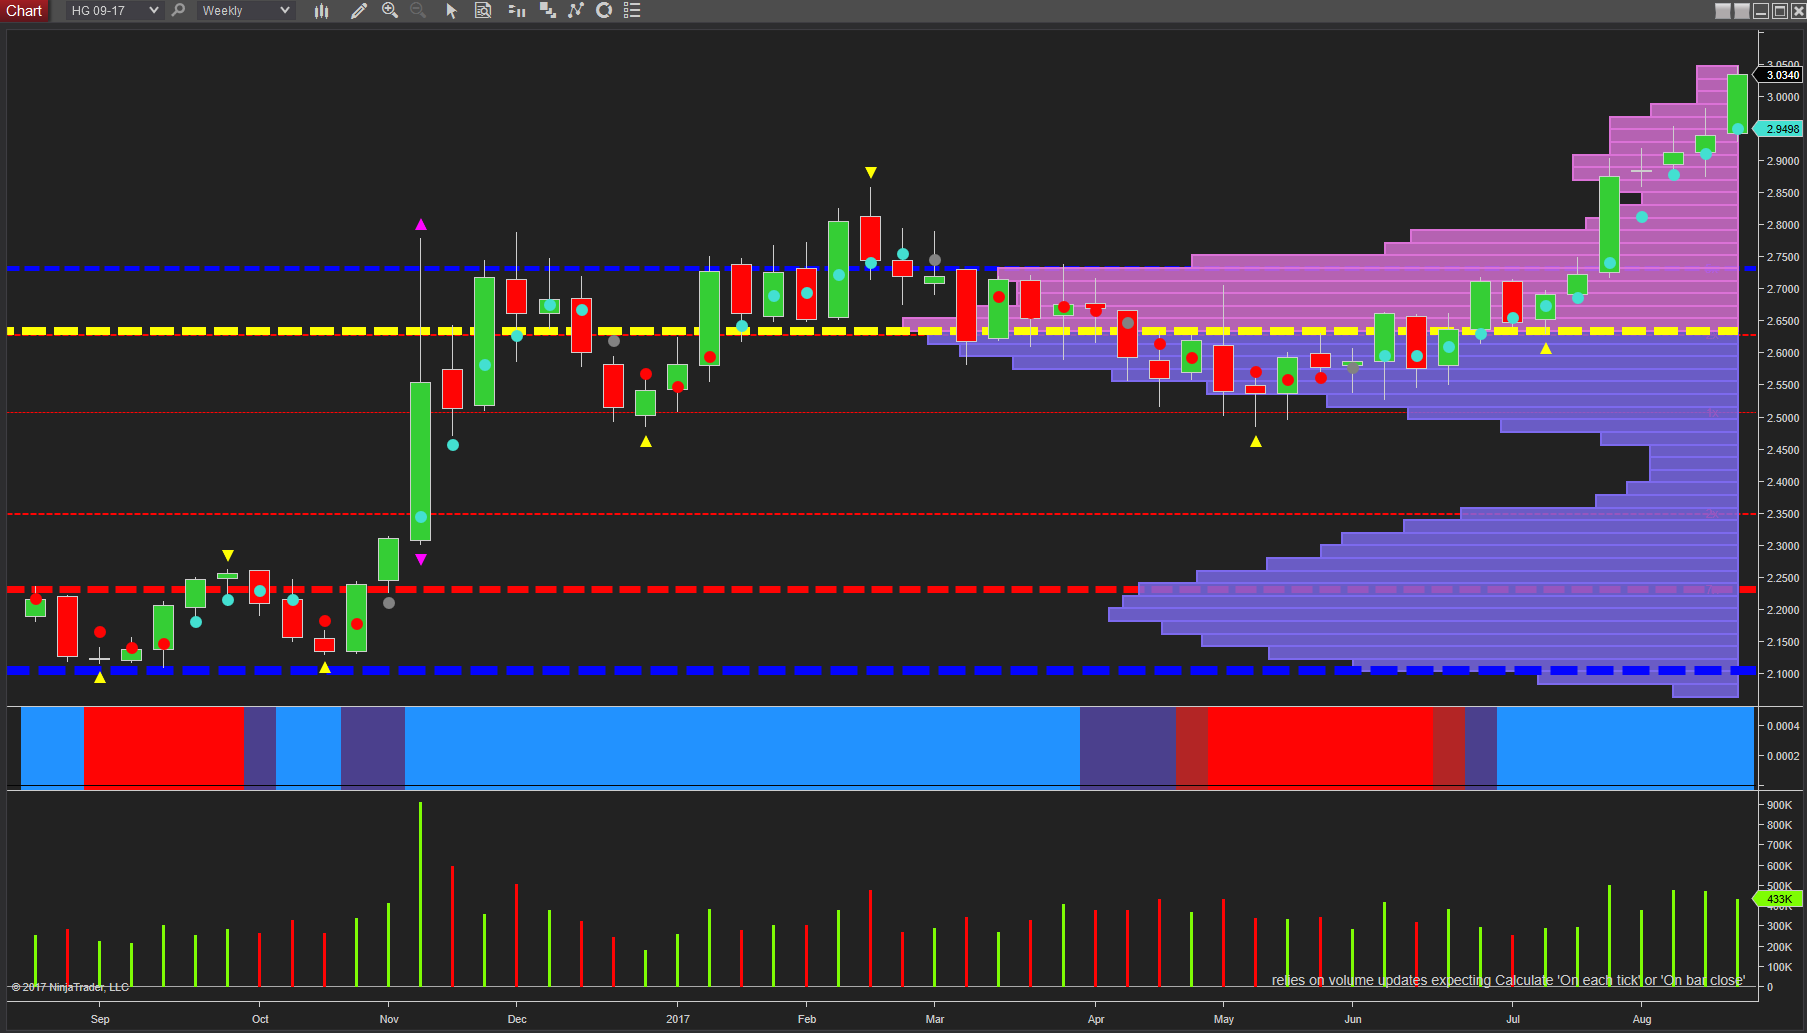
The move in copper is entirely understandable and supportable when considered from a technical perspective, and more particularly when applying volume price analysis to the chart. Volumes throughout June, and for most of July remained average to low, and in line with the associated price action, with mildly bullish sentiment based on narrow spreads on the day. A move through the $2.7120/lb area duly established a platform of support with the wide spread up candle on ultra high volume then confirming the break away from this trading range on the 27th July. This was duly followed with further upwards momentum before a further injection of volume moved the price action higher once again on the 16th August, with another wide spread up candle on excellent volume. Finally, today’s price action has propelled copper through the psychological $3.0000/lb region and on to trade higher at $3.0355/lb at the time of writing, and clearing away from the short term resistance built during the week. Scary indeed for those traders now shorting copper on an opinion, and with no evidence to suggest we are approaching a top just yet, the shorts looks set to be squeezed further as copper continues its stately progress higher.
Disclaimer: Futures, stocks, and spot currency trading have large potential rewards, but also large potential risk. You must be aware of the risks and be willing to accept them in order to invest in ...
more

