
Consolidating The Breakout
Last Tuesday, we updated our commentary on the “jailbreak” which occurred last week with the move above resistance and the previous closing high downtrend. To wit:
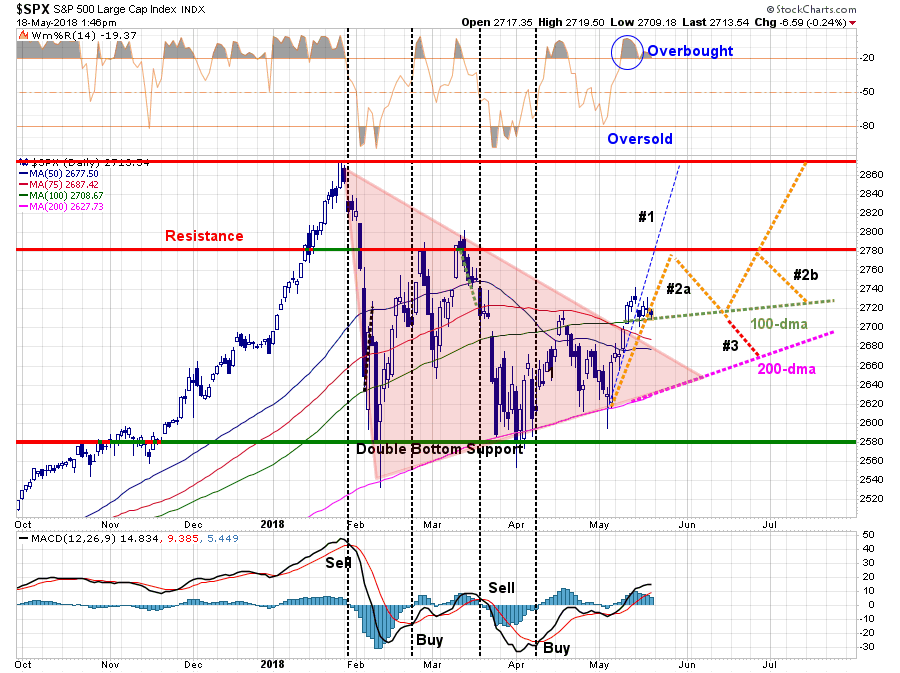
“With the market back to very short-term ‘overbought’ territory, a bit of a pause is likely in order. We currently suspect, with complacency and bullish optimism quickly returning, a further short-term advance towards 2780 is likely.
- Pathway #1 suggests a break above the next resistance level will quickly put January highs back in view. (20% probability)
- Pathway #2a shows a rally to resistance, with a pullback to support at the 100-dma, which allows the market to work off some of the short-term overbought condition before making a push higher. (30% probability)
- Pathway #2b suggests the market continues a consolidation process into the summer building a more protracted “pennant” formation. (30% probability)
- Pathway #3 fails support at the 100-dma and retests the 200-dma. (20% probability)”
Chart updated through Friday:
“Again, these are just ‘guesses’ out of a multitude of potential variations in the future. The reality is that no one knows for sure where the market is heading next. These ‘pathways’ are simply an ‘educated guess’ upon which we can begin to make some portfolio management decisions related to allocations, risk controls, cash levels and positioning.
But while the short-term backdrop is bullish, there is also a rising probability this could be a ‘trap.’”
Over the past week, the market did consolidate its recent breakout by pausing just above the previous resistance level of the 100-day moving average.
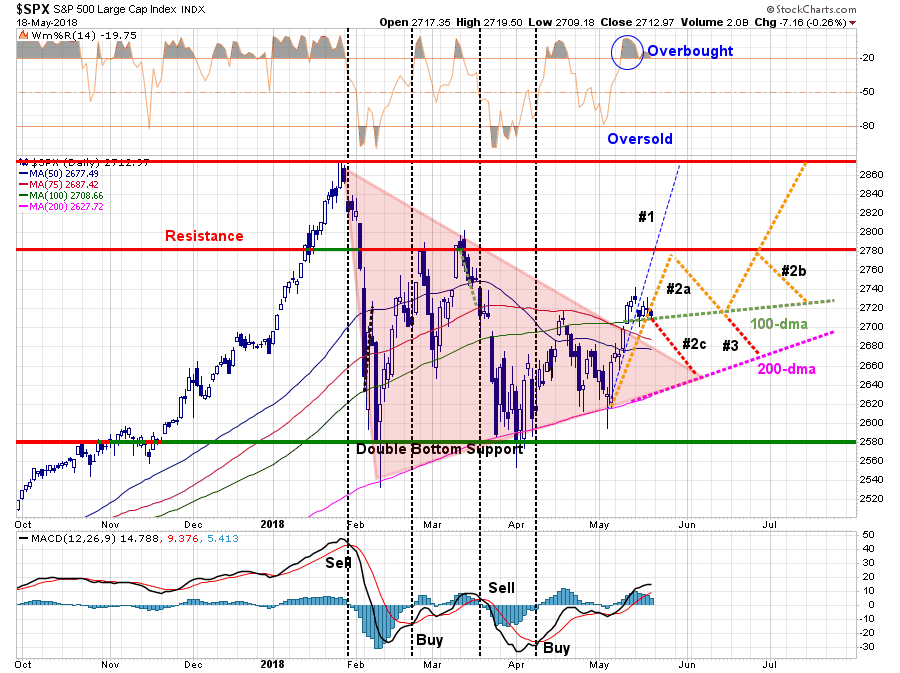
As shown, in the first chart above, this “pause” sets the market up for a continuation of pathway #2a to the next level of resistance. However, there is a reasonable possibility that has opened up of a new path (#2c) which could lead to another retest of the 200-dma if the market breaks the current support.
Pathway #2c is currently a binary outcome and will only exist next week. Either the market will move higher next week and continue following pathway #2b or it won’t. Monday will likely “tell the tale” and I will update this analysis in Tuesday’s report.
Where does that leave us now in terms of our portfolio models?
I noted last week that we added some of the cash we had raised on rallies over the last couple of months back onto the equity side of our portfolios. However, we still maintain an overweight position on cash currently as a hedge against potential market risk. (In this case pathway #2c)
If the market is able to move above last week’s highs, we will add further exposure to equity risk side of the portfolio. But, we will do so with very tight stop-loss levels and with added hedges as necessary. A failure of support will keep our cash levels elevated and we will wait to see where the market finds its next support before taking further actions.
Our concern over the broader market remains, and I have expanded that list further this week:
- The Fed is raising interest rates and reducing their balance sheet.
- The yield curve continues to flatten and risks inverting.
- Despite strong earnings this past quarter, valuations remain very elevated.
- The lack of liquidity in both the bond and equity markets are of great concern.
- Market leverage remains at historically high levels. (Which isn’t a problem until it is.)
- Credit growth continues to slow suggesting weaker consumption and leads recessions
- The ECB has started tapering its QE program.
- Global growth is showing signs of stalling.
- Domestic growth has weakened.
- While EPS growth has been strong, year-over-year comparisons will become challenging.
- Rising energy prices are a tax on consumption
- Rising interest rates are beginning to challenge the valuation story.
We remain invested, but are also highly aware we are closer to the end of the “bullish-half” of the market cycle than not.
Why? Valuations, silly.
“Only 9% of the time in history have U.S. stocks been so expensive.” –David Rosenberg, Gluskin-Sheff
Rosenberg recently showed a table of gross domestic product (GDP) growth figures during the last nine bull rallies. The table reveals a dire trend where each subsequent bull rally in the last 70 years generated less GDP growth. The important message is that investors have consistently been paying more, for less growth.
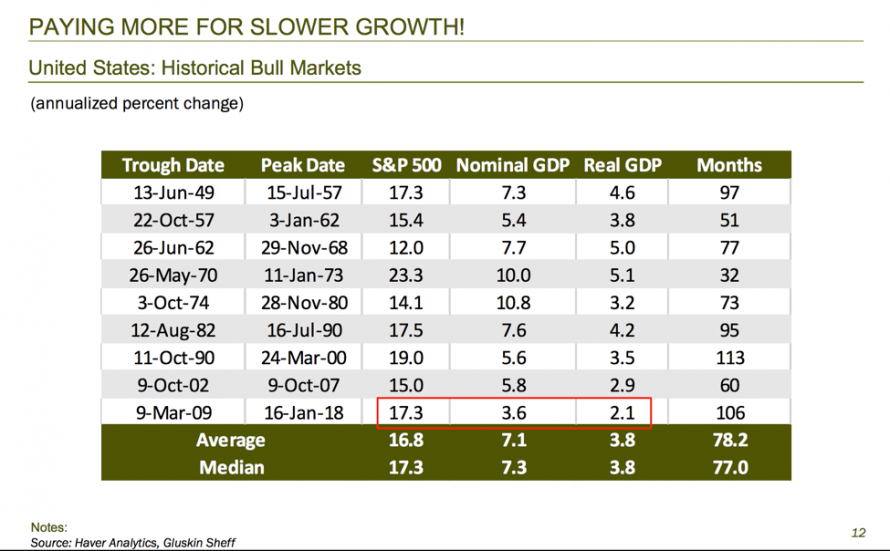
The market is currently overpriced and overvalued by about a third. While investors can certainly bid up prices in the short-term, the long-term fundamentals will eventually come to play.
With households more exposed to financial assets currently than at any other point in history, the next downturn will be greatly exacerbated by the “panic” that ensues. As you can see in the chart below, the last two peaks in this ratio almost perfectly coincided with the dot-com crash and the 2008 financial crisis.
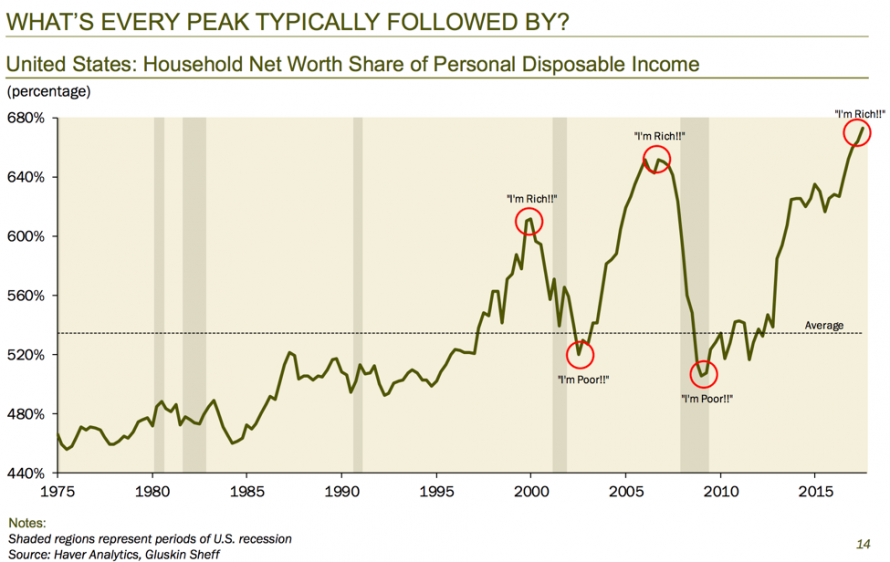
David’s most salient point came from a quote from Federal Reserve Bank of San Francisco. He pointed out that, having access to tons of research, they themselves admit that equity valuations are so stretched that there will be no returns in the next decade:
“Current valuation ratios for households and businesses are high relative to historical benchmarks … we find that the current price-to-earnings ratio predicts approximately zero growth in real equity prices over the next 10 years.”
Basically, the Fed is giving investors an explicit warning that the market will “mean revert.”
But revert, doesn’t mean stop at the mean.
According to David’s calculations, if the household net worth/GDP ratio reverted to the mean, savings rates would go from 2% to 6%. As a result, GDP would go down 3%, which would have nasty consequences for the economy and, in turn, stocks.
Just something to think about.
Another Nail In The “Buy and Hold” Coffin
My friend Greg Morris sent me a fantastic chart this morning that goes to the very point of my recent discussion on the “Myth of Buy and Hold” investing. Since 1895, the Dow, using daily data, has spent just 4.32% of its time at “new highs.” The rest of the time, investors were simply making up previous losses.

The important point here is that starting valuations matter “a lot” as to future returns. While it is absolutely true that given enough time a “buy and hold” investor will indeed make money, it will just be far short of the financial goals they planned on.
As I noted in yesterday’s missive on “Bear Market Repos:”
“Don’t ‘confuse the math.’ A 30-50% decline from any level in the market is destructive not only to your current principal value both also your financial goals particularly as it relates to you investing time horizon.”
“Time” is the one commodity we can’t get back.
Whither Interest Rates
by Doug Kass
“I used to think that if there was reincarnation, I wanted to come back as the president or the pope or as a .400 baseball hitter. But now I would like to come back as the bond market. You can intimidate everybody.” – James Carville, Democratic Party strategist
While I can make an educated guess, I am not an econometrician so I can’t really make a rigorous interest rate forecast.
I can, however give an historic perspective on what current rates are telling us and, provide the calculation of where interest rates should be given current inflationary expectations and specific (or consensus ) domestic GDP projections.
So, let’s go through my methodology.
My focus is on the ten year US note.
* Historically (over the last five decades) the yield on the 10-year has approximated nominal U.S. GDP (inflation plus real GDP). In other words, if inflation is 2% and GDP is 2.5% nominal GDP is 4.5% — the ten year U.S. note has, on average, yielded 4.5%.
* Rarely has the relationship between the 10-year yield and nominal U.S. GDP moved under 0.8x.
* But, given the Amazon deflationary effect when coupled with the ECB anchoring short-term rates in Europe, perhaps the 10-year yield should be lower as measured against nominal U.S. GDP.
* Let’s be conservative and assume the multiplier moves from the five decade average of 1.0x to 0.8x.
* 10-year breakevens rose by three basis points yesterday to 2.20%. (This is our inflation measure to be used in our equation.)
Our New Equation: The Ten Year U.S. Note Yield (3.1%) = 0.8 [Inflation (2.20%) + Real U.S. GDP (X%)]
We can now solve the following:
1. What Real U.S. GDP growth rate is the 3.1% yield on the 10 year U.S. note predicting? Solving for X (above) produces the conclusion that the current note yield and inflationary expectations (breakevens) produce an implied Real GDP growth rate of only +1.675%, well below consensus economic expectations for 2018-19.
2. If Real U.S. GDP growth meets the consensus (+2.5%), where should the 10-year note yield be? Solving this question by making X=+2.5% (consensus Real GDP projections) produces an expected ten year U.S. note yield of 3.76%,more than 65 basis points above the current yield.
The question remains whether economic growth, currently in the second longest expansion on record, can accelerate to 2.5% annually, or if the rise in rates sparks the next recession leading to substantially slower rates of economic growth.
Market & Sector Analysis
Data Analysis Of The Market & Sectors For Traders
S&P 500 Tear Sheet

Performance Analysis
ETF Model Relative Performance Analysis

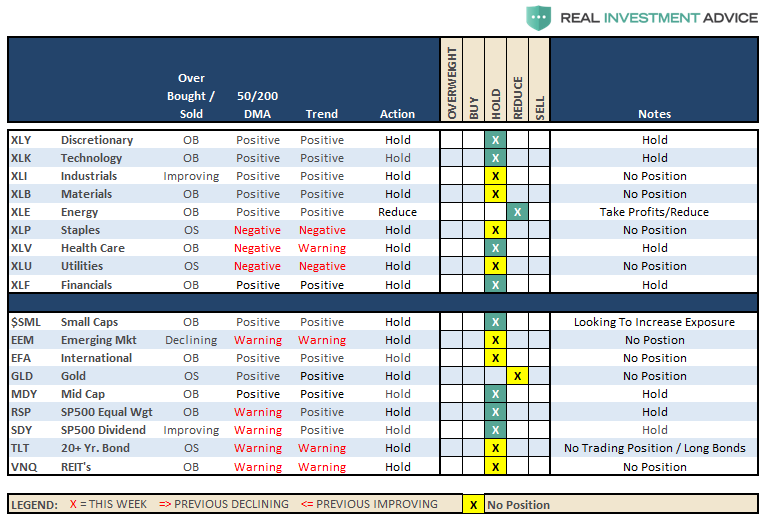
Sector & Market Analysis:
As noted above, we are watching closely the consolidation following the recent breakout of the markets from the downtrend line from the January highs. While we recently added some equity exposure to our portfolios we are still overweight cash at this juncture waiting for the market to dictate our next course of action.
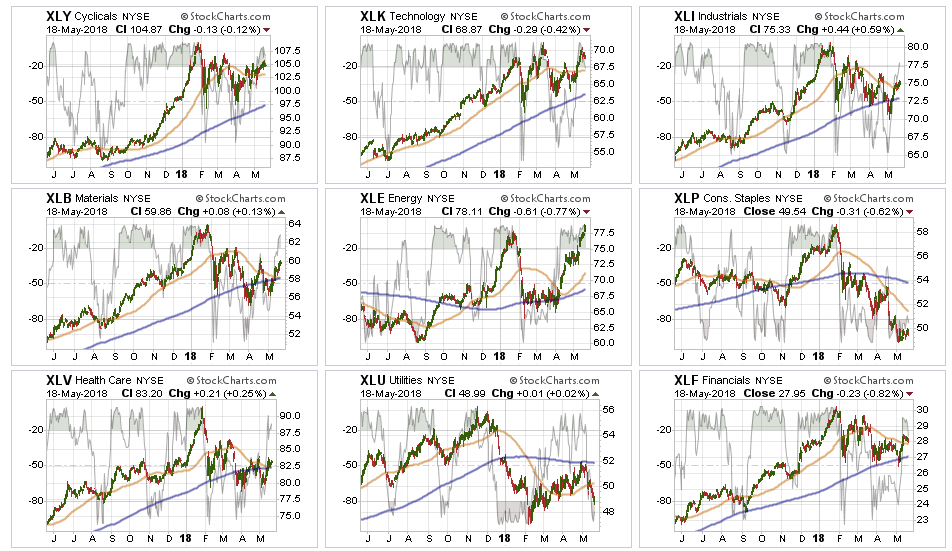
Energy led the advance last week as oil prices pushed to $70/bbl. As we noted previously, with record long positions in oil future contracts, the energy sector is extremely overbought and extended. Some profit taking from the recent advance, which has only recovered the sector back to January’s levels, is advisable.
Discretionary, Financials, Technology, Industrials, Materials, and Health Care improved performance last week and held above their respective 50-dma’s. With the improvement in the Materials and Industrial sectors, we will look for an opportunity to add exposure to these groups opportunistically, after having been out for the last couple of months.
Staples – There is a potential rotation trade being built in this sector. It is too soon to buy into staples just yet, but we may be getting close to a decent trading opportunity. We are watching closely particularly as we move into the summer months.
Utilities fell apart last week with the “pop” interest rates. We remain out of the sector for now, but keep a watch for a rotation trade in the weeks ahead.
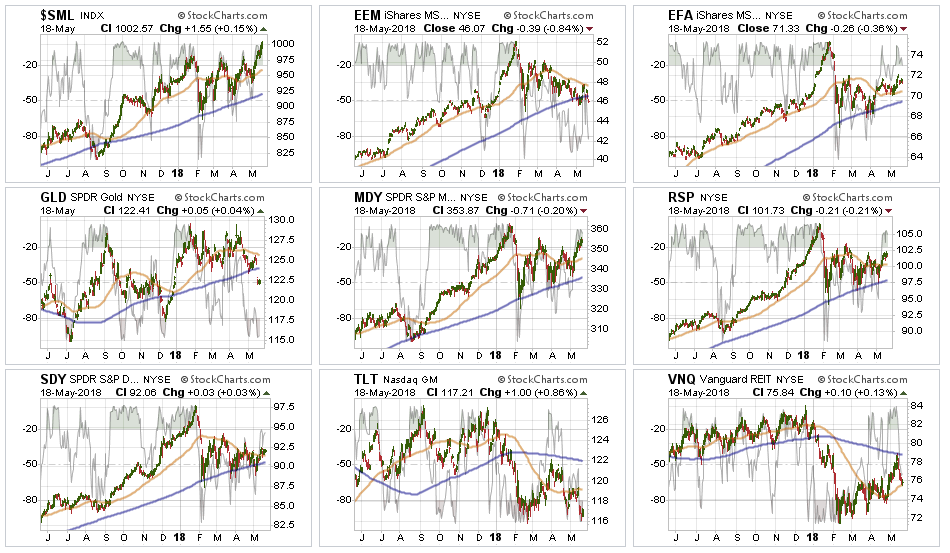
Small-Cap and Mid Cap performed well during last week’s advance with small-caps leading the charge and breaking out to an all-time high. The break above the triple-top for small-caps put us in a position to add to the sector on any weakness.
Emerging and International Markets remain lackluster in terms of performance currently. We previously removed our holdings in these markets and remain domestically focused at the moment. We will continue to monitor performance for an opportunity if it presents itself.
Dividends and Equal weight continue to hold their own and we continue to hold our allocations to these “core holdings".
Gold failed to hold important support at the 200-dma last week. We currently do not have exposure to gold and have been out for a long time. We previously suggested that “if you are already long the metal hold for now. $123 on GLD is a hard stop.” That stop was triggered, so profits should likely be harvested on any failed rally back to the 200-dma for now.
Bonds and REITs – last week interest rates once again poked above the important 3% level. Bonds and REIT’s fell apart last week and while holding previous support levels, the “trade” has broken. We remain out of these positions for now, but as with Staples and Utilities, there is likely a good “counter-rotation” trade being set up. We will look for opportunities accordingly.
The table below shows thoughts on specific actions related to the current market environment.
(These are not recommendations or solicitations to take any action. This is for informational purposes only related to market extremes and contrarian positioning within portfolios. Use at your own risk and peril.)
Portfolio/Client Update:
Over the last several weeks, we have continued to maintain higher levels of cash than normal as market volatility had markedly increased. In last week’s update, we noted the breakout of the consolidation range which provided the market with some upside in the short-term. From a portfolio management perspective, we used that breakout to put some of our excess cash weightings back to work as follows:
- In ETF model portfolios were added weight to Discretionary, Technology, Health Care and Financials as well as our “core” holdings. In existing accounts, we rebalanced to target weights in those holdings. For new accounts, we moved into the on-boarding process by adding 50% of target weights.
- In Equity model portfolios we added 50% to our target weights in our targeted companies. We will add the other half on weakness in the market which does not violate the bullish trend.
- The same goes for our Equity/Option Collar portfolio. Once we complete the position purchases we will then collar each position with a “cashless collar” to hedge exposure.
- The same positioning applies to the Equity/ETF blended model with 50% of target weights being added for new accounts and rebalancing to target for existing portfolios.
We continue to honor the current “bullish trend,” but also remain very aware of the risks. As stated in the newsletter, all actions over the past week are “trading positions” with very tight stops and risk management processes in place.
If the market fails we will raise cash and add hedges. If not, these “trading positions” will become longer-term “investments".
The rally remains weak and lacks real conviction. But as we noted previously:
“If the market can break above the current downtrend channel on heavy volume, confirming a breakout, we will reallocate and rebuild portfolio models accordingly.”
It did and we did.
That is the process we follow. But it doesn’t mean we have to “like it.”
However, “not liking” something is an “emotional bias” that we must keep in check through our discipline and strategy.
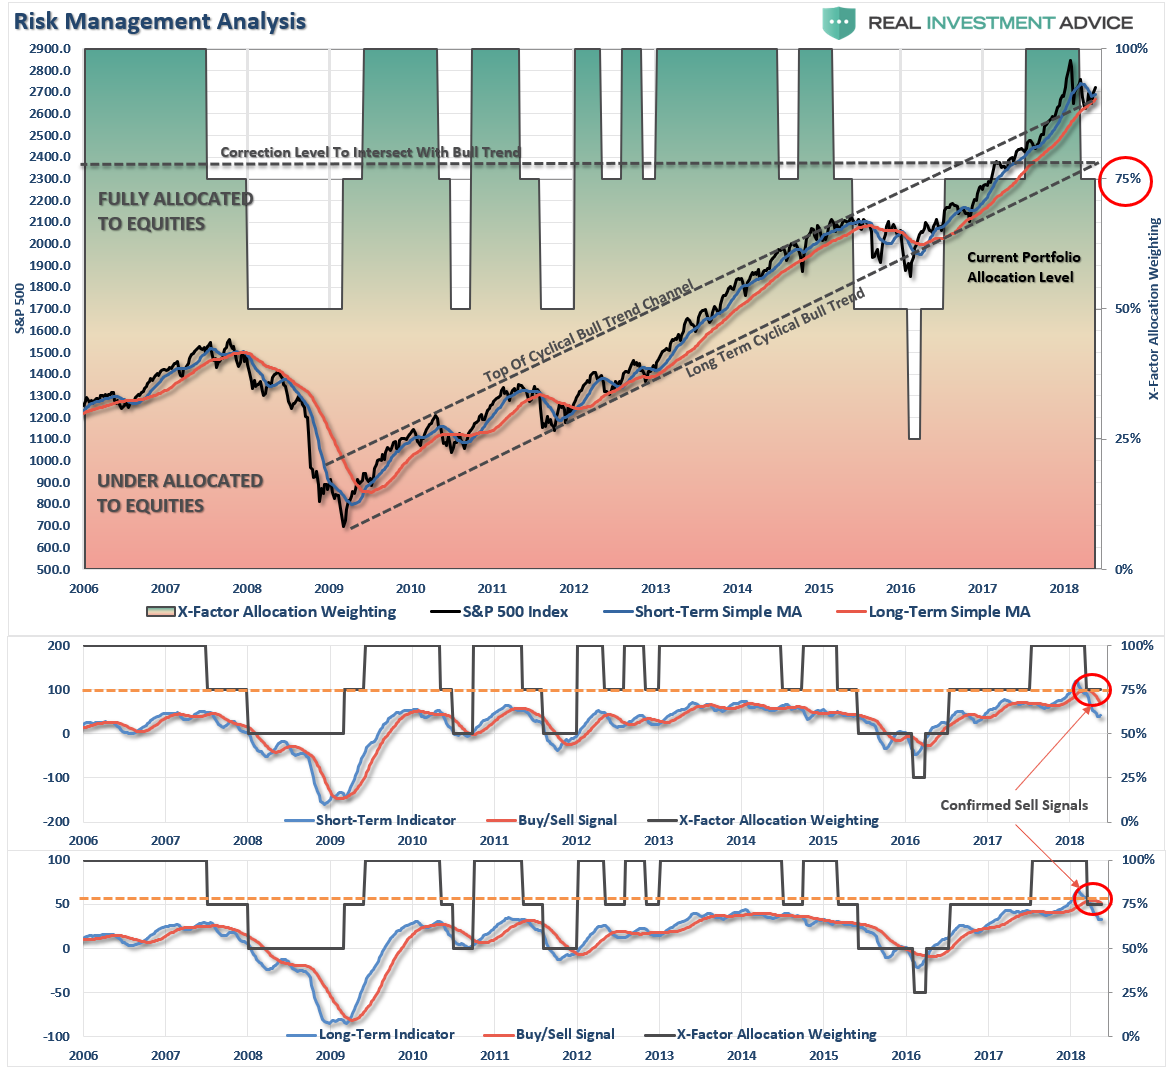
We remain keenly aware of the intermediate “sell signal“ and we will continue to take actions to hedge risks and protect capital until those signals are reversed.
THE REAL 401k PLAN MANAGER
The Real 401k Plan Manager – A Conservative Strategy For Long-Term Investors

There are 4-steps to allocation changes based on 25% reduction increments. As noted in the chart above a 100% allocation level is equal to 60% stocks. I never advocate being 100% out of the market as it is far too difficult to reverse course when the market changes from a negative to a positive trend. Emotions keep us from taking the correct action.

Consolidation Of The Breakout
I highly suggest you read the main body of the newsletter this week. It contains much information that is relevant to our 401k plan positioning.
Currently, our model remains underweight equities at the moment as we have to respect both of the “sell signals” that currently remain intact as shown above. We also try to remain cognizant of the “trading restrictions” that exist in most 401k-plans. Over the last couple of months, we have been recommending to reduce equity allocations as follows.
We have also, during that time, stated that:
“If you have already reduced equity exposure, just sit tight this week and let’s see what happens.”
Last week’s instructions remain:
- If you are new to reading the newsletter or have NOT taken any previous actions or are overweight equities in your plan – Do nothing.
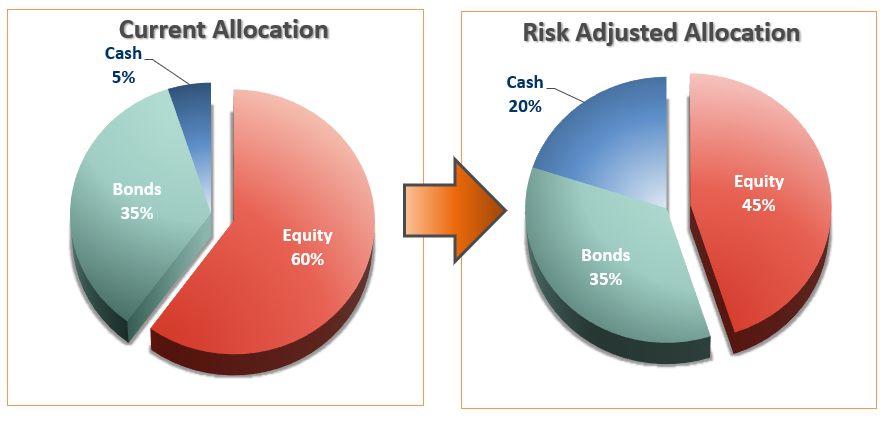
- If you are slightly underweight equities in your plan – move to the RISK ADJUSTED allocation model.
- If you are very underweight equities in your plan – move 50% of the way toward the RISK ADJUSTED model.
While conditions have improved in the short-term, we are not out of the woods just yet. Remain aware of the risks and pay attention to your portfolios.
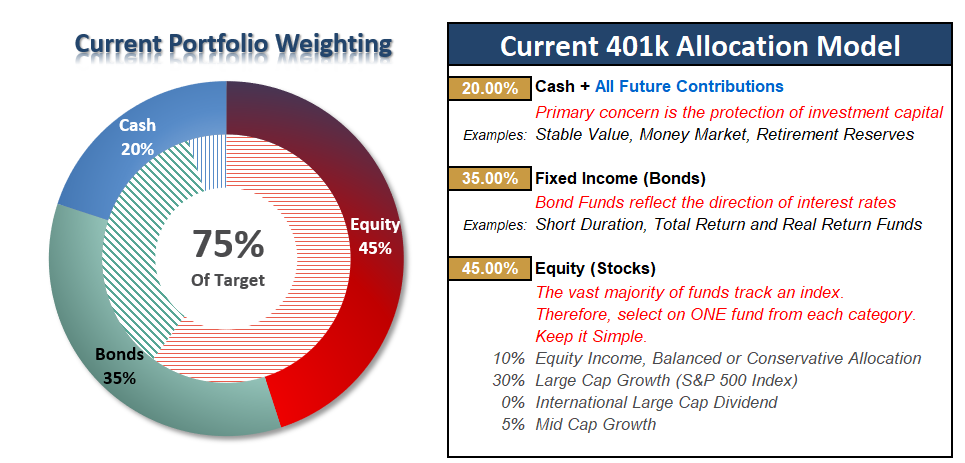
Current 401-k Allocation Model
The 401k plan allocation plan below follows the K.I.S.S. principle. By keeping the allocation extremely simplified it allows for better control of the allocation and a closer tracking to the benchmark objective over time. (If you want to make it more complicated you can, however, statistics show that simply adding more funds does not increase performance to any great degree.)
401k Choice Matching List
The list below shows sample 401k plan funds for each major category. In reality, the majority of funds all track their indices fairly closely. Therefore, if you don’t see your exact fund listed, look for a fund that is similar in nature.

Disclosure: The information contained in this article should not be construed as financial or investment advice on any subject matter. Real Investment Advice is expressly disclaims all liability in ...
more

