
Cocoa Technical Analysis
Latest Price – $2552
Weekly Chart
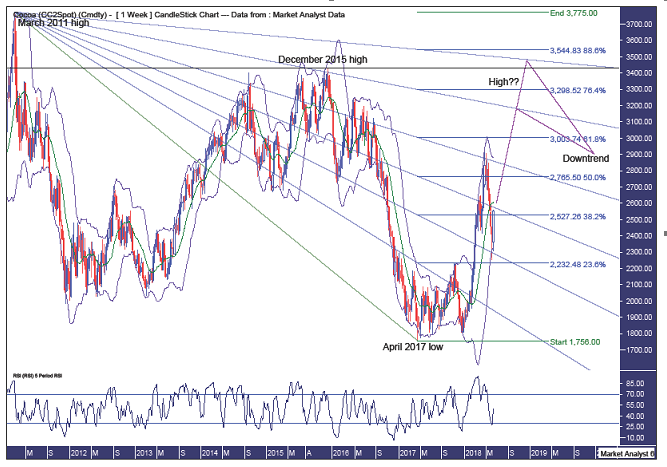
Pattern – we have a pattern of lower lows and lower highs on this chart signifying a downtrend. Given that price has risen sharply this year so the question becomes is this the start of a new bull trend? No, not in my opinion.
Bollinger Bands – price came down to the lower band where support came in and price has bounced back up to near the middle band. While price may encounter some resistance around this middle band I expect it to eventually give way with price heading up to the upper band and beyond.
Fibonacci – price recently turned back down after hitting resistance from the 61.8% angle while the recent low was at support from the 38.2% angle. I am targeting this rally to terminate at either the 76.4% angle (which is the same angle that brought in the December 2015 high) or the 88.6% angle. At a minimum, I expect price to rise up to the 61.8% retracement level of $3003 although price rising as high as the 88.6% level of $3544 would not surprise. In fact, if I had to choose one level between the 61.8%, 76.4%, and 88.6% levels, it would be the 88.6% level.
Horizontal line – denotes the December 2015 high of $3429. Does this rally top out below or above this level? I personally lean, just, to above but a lower high is certainly a real opportunity and will need monitoring.
RSI - another bullish week will see this indicator move into strong territory.
Monthly Chart
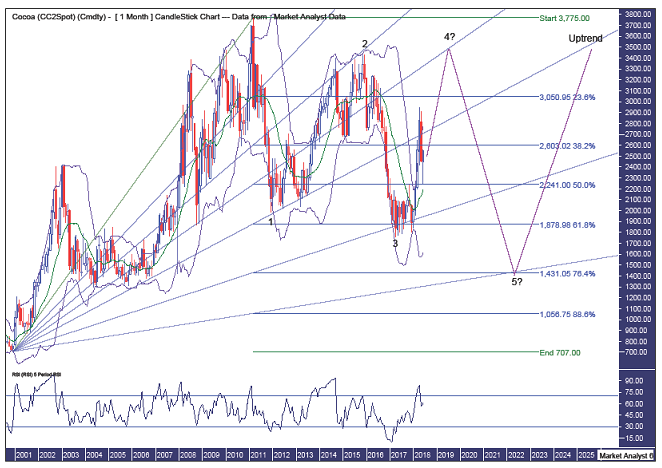
Pattern – the 2011 high of $3775 remains in place and I believe this high will hold for some time yet. With a pattern of lower lows and lower highs since that 2011 high, it is certainly possible for another lower high to form. But I want to give consideration to a 5 point broadening low forming with price currently tracing its way to a point 4 high.
Bollinger Bands – price pulled up just above the middle band and I expect price to get back to the upper band now and trade even higher.
Fibonacci – this fan drawn from the 2000 low to 2011 high shows some excellent symmetry. The point 1 low at the 61.8% angle, the point 2 high at the 38.2% angle and the point 3 low at the 76.4% angle. I am looking for the point 4 high to be around resistance from the 50% angle with the final point 5 low back at support from the 88.6% angle. This 88.6% angle intersects with the 76.4% retracement level of $1431 in mid-2002 so that is some price and timing for the final low. All in good time.
RSI – strong.
Summing up – I expect price to continue solidly higher over the coming months after which a big move down will become the new expectation.
Disclaimer: The above is a matter of opinion provided for general information purposes only and is not intended as investment advice. Information and analysis above are derived from sources and ...
more

