

Fundamental Forecast for USOIL: Bullish
Talking Points:
- The ONE Thing: Crude moved higher on a multitude of factors for the sixth straight week. The consecutive weekly gains is the longest stretch since 2011 as the market is seen as balanced thanks in part to OPEC production cuts alongside fears that Iranian sanctions could tighten the market further.
- By looking at the US energy market, you would never imagine that the global market continues to tighten. US production continues to grow and exports of crude and distillate are reaching records per the EIA helping the US earn the moniker, ‘Saudi America.’
- Per BHI, U.S. Oil Rig Count unchanged at 844 following six weeks of increases.
- The technical analysis picture of Crude Oil clearly shows price trading above multiple forms of support with momentum at its back. Key support can be found at the price range of the 9- & 26-day midpoint at $76.53-75.66/bbl. These components come from the indicator, Ichimoku.
Crude oil broke another technical barrier this week and further distanced its current performance against memories of the aggressive bear market of 2014-early 2016. In short, a banner week is in the books as Brent Crude broke $80/bbl and has risen by +18.5% Year-to-date, and research was recently published about the knock-off effects of $100/bbl oil. You would have a hard time arguing that a crash is imminent as the world is now considering how it will cope with Oil potentially moving 25% higher.
Supportive Factors
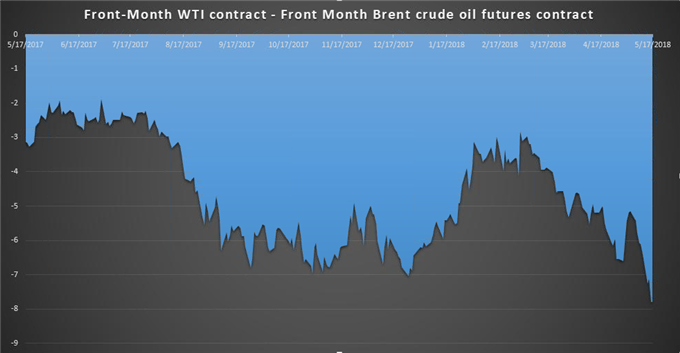
Crude has been blamed for overheating for the better part of the year, but the trend has continued. What’s more, when looking at WTI and Brent, the premium that Brent has to WTI or the WTI-Brent spread is blowing out.
Massive Discount
Date Source: Bloomberg
The discount on WTI compared to Brent is shown by the falling blue line. The reason for the massive discount of WTI has widened due to the massive supply growth in the US, though US stockpiles are still falling while global supply continues to fall thanks in part to the following factors:
- Sharp deterioration in Venezuelan production
- US President Trump’s imposed sanctions on Iran
- Strong OPEC compliance with production curbs
- Sell-off in bonds as UST 10Yr yield moves above 3% shows advanced economic cycle that is supportive of crude
Overheating or Strong?
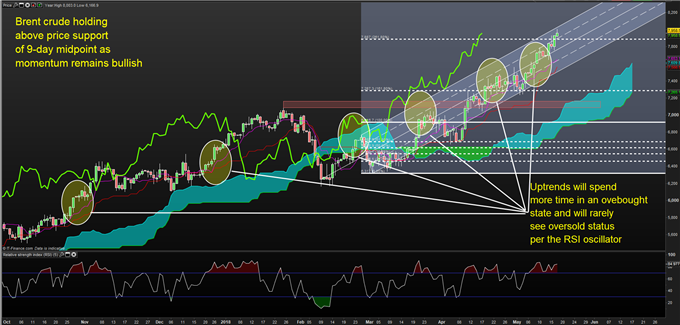
Chart Source: Pro Real Time with IG UK Price Feed. Created by Tyler Yell, CMT
The break above $80/bbl was the highest price per barrel of Brent since 2014. The technical picture when looking at the price chart shows that the market may be overheating per the Relative Strength Index or RSI. Traders should not confuse overheating with topping.
Short-term support can be found at the price range of the 9- & 26-day midpoint at $76.53-75.66/bbl. These are Ichimoku levels applied to daily trading data that have provided a clear view of bullishness since mid-March.
Next Week’s Data Points That May Affect Energy Markets:
The fundamental focal points for the energy market next week:
- Sunday: Venezuelan Elections
- Tuesday 04:30 PM ET: API Weekly Oil Inventories Report
- Wednesday 10:30 AM ET: EIA issues weekly US Oil Inventory Report
- Friday 1:00 PM ET: Baker-Hughes Rig Count
- Friday 3:30 PM ET: Release of the CFTC weekly commitments of traders report on U.S. futures, options contracts



Comments
Log in or sign up to join the conversation.