
Bakken Update: Economics Improve As Costs Decrease And Enhanced Completions Improve Production
Before the price of oil fell, most thought the average shale focused E&P would need $80/bbl WTI to turn a profit.Now that oil is hovering around $50/bbl, and the US Oil ETF (USO) is trading below $11/share, those estimates are much lower.Estimates are deceiving, as analysts were averaging all acreage.Since most operators are focusing on core leasehold, estimates should do the same.Some acreage still needs oil at $80/bbl, but these fringe areas are not economic.Many fringe players have declared bankruptcy, and this trend is likely to continue.Some analysts have changed estimates to $60/bbl, but some operators are adding rigs and increasing production.It is possible some operators are thinking ahead.It can take months before a rig is put to work and an operator sees a location turned to sales.
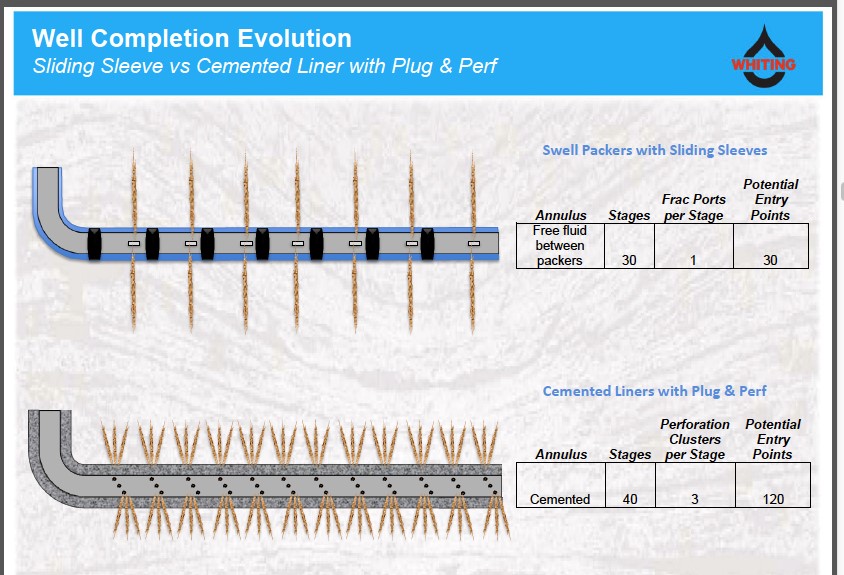
There is a relatively large difference in operator break evens.Keep in mind, breakeven is not good enough.Operators need to produce returns. Each operator is different based on acreage returns.Production isn’t the only variable.The percentage of resource is important, and many operators are focusing on combo plays.Many of the best plays still produce a decent percentage of natural gas.The main reason is well pressure.If an interval produces about 20% to 35% natural gas, the well will produces larger IP rates.This is measured over the first 30, 60 and 90 days.This means plays that produce natural gas and crude will maintain well pressures better over a period of time.Newer well designs seem to provide better results and a flatter decline curve.This means production holds up better and one would see production continue at higher rates. Essentially, better geology and well design are really improving production numbers.Operators have followed EOG Resources’ (EOG) lead, and focused on breaking up the source rock better around the well bore.This means the rock is cracked or broken up better.The well bore has more contact with the interval, and hence more crude, natural gas and NGLs are produced in a shorter period of time.
![]()
(Source: Whiting)
The above picture provides a good visual as to how newer well designs are able to break up shale better for operators like Whiting (WLL).By having the ability to break up rock in more contact points helps to produce more resource per foot.It improves well economics by increasing revenues.When more fracs produce, more fluids and proppant are needed per well.This benefits fluids producers like Flotek (FTK) and Newpark (NR).It also provides increased demand for proppant which helps frac sand producers like US Silica (SLCA), Hi-Crush (HCLP), Fairmount (FMSA), and Emerge (EMES).The greater the rock void created, the larger the volumes of proppant and fluids are needed.I have done a great deal of work on Mega-Fracs and the improved production seen.The returns have improved, but these wells also have higher costs.Operators have not moved solely to Mega-Frac style wells, but as we move forward we are seeing it done more.The majority of wells are using more oil related commodities; as perf clusters are added per stage.This will continue, and operators will find whatever the most appropriate recipe is needed.
Production is important, but keeping costs down are as well. Operating costs are taken from each barrel, so revenues are not the key.If a location produces record production for an area, it would matter little if the operator lost money doing it.With oil prices at $50/bbl or less each dollar is important.Operators have done an excellent job of cutting costs as oil prices fell.This has been done through improved productivity and by negotiating lower costs from oil service companies.Operating costs are removed from revenues, when figuring out how quickly a well reaches payback.
The differences in operator economics are significant.In the new oil price environment, only the best will survive.Those that do, will grow through consolidation.These companies should continue to do well for years to come, and could be good long term investments.I am covering several operators to show the improvements seen over the past couple of years.These improvements are the reason why operators need a lower oil price to drive returns.
EOG Resources (EOG) may be one of the best examples of an E&P that has improved production and decreased costs.
![]()
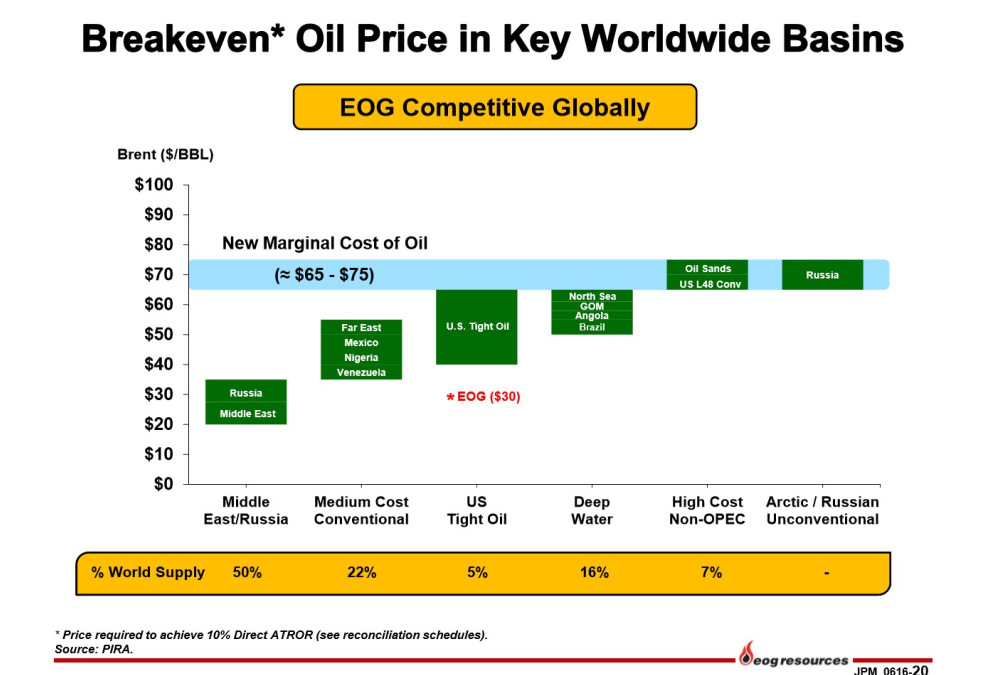
(Source: EOG)
EOG shows most US tight oil has break evens below the new marginal cost of oil.Oil sands, US conventional and Russian unconventional wells have economics below that of shale.EOG’s breakeven is at $30/bbl.This has to do with all of the variables listed above.It is competitive with Russia and the Middle East.The new world oil price environment needs 7% of the world’s current production to meet demand.Keep in mind, Russia and OPEC are increasing production which will tip the scales a bit.Luckily, it probably cannot increase enough to threaten US core plays.We could see countries like Iran and Saudi Arabia increase production, but this will threaten deep water.These wells can take years to bring on line with lower success rates than shale.Deep water also needs a much larger investment.We have already seen this development halted.It has hurt operators like Transocean (RIG), Diamond Offshore (DO), and Seadrill (SDRL).Given the very large percentage of production coming from offshore, it could take years to get that production back on line.The lack of investment due to capex cuts may create a supply issue.This in our opinion will be the greatest part of why oil inventories will begin to decrease next year.
![]()
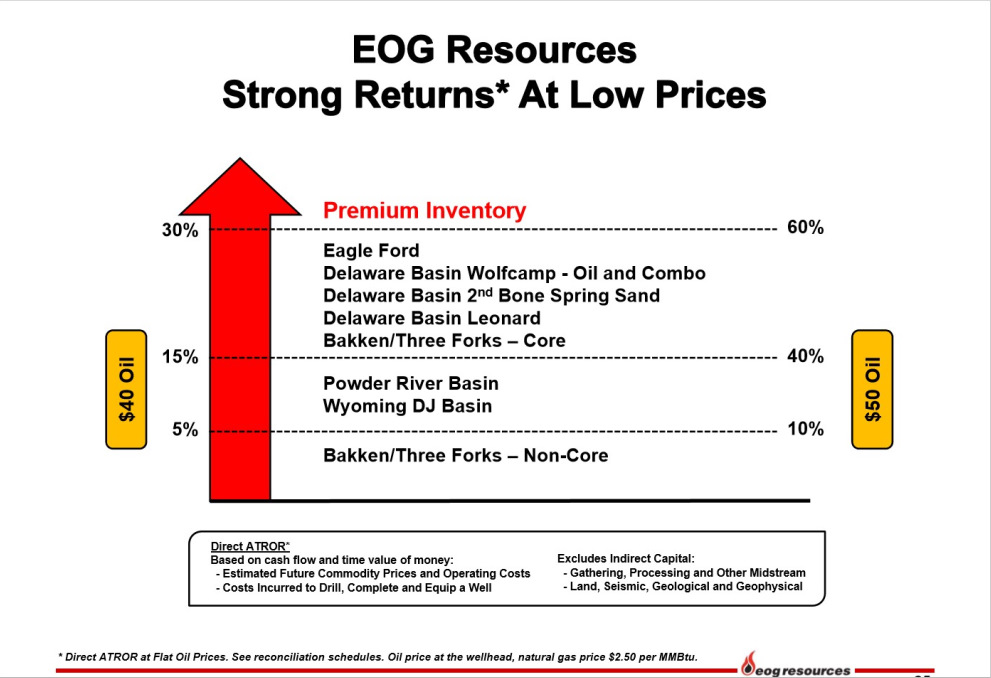
(Source: EOG)
EOG’s premium inventory (Eagle Ford and Delaware Basin core) returns over 60% at $50/bbl oil.At $40/bbl it sees returns above 30%.The Eagle Ford continues to be its flagship, but its new Delaware Basin position has better geology.The problems with the Delaware is development.It is relatively new, but EOG was smart enough to grab acreage cheap and early.EOG has some of the best returns in the industry.It has done this by collecting very good geology, having a top notch well design, and keeping costs in check.
![]()
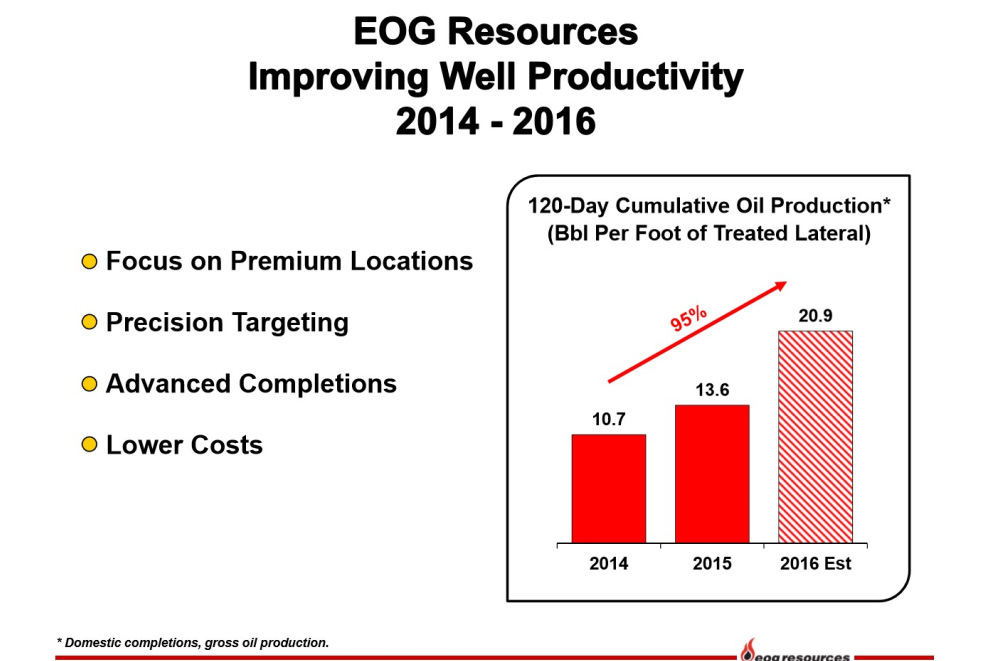
(Source: EOG)
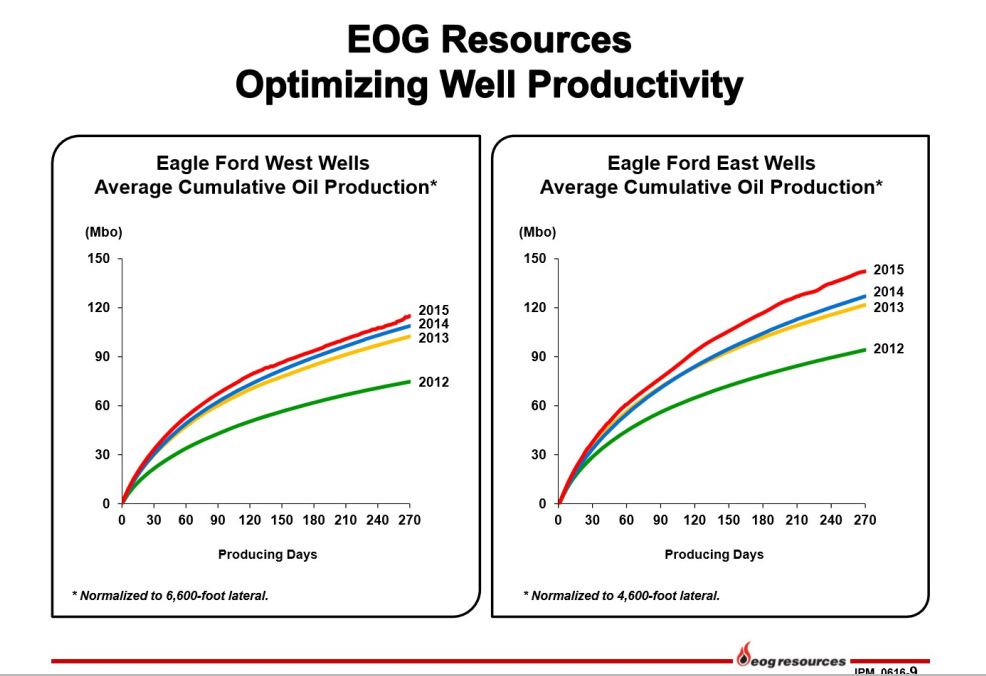
EOG well productivity has improved by 95% since 2014.It is important that EOG measures improvement by foot.This means results are not skewed by longer laterals. To produce 20.9 BO per foot over 120 days of well life is huge.There are some web pages currently showing operator production, but none effectively consider lateral length.Some operators will drill a longer well, which does increase total production.This doesn’t necessarily mean the operator is more productive.EOG drills a lot of one-mile laterals.This provides more operator control.By dividing production by lateral length, we see how productive the operator is.It takes less money to drill and complete 5,000 feet versus 10,000.EOG has seen well design improvements, but also because it is focusing on its best acreage with the lowest costs. The Eagle Ford shows how production continues to improve.
![]()
(Source: EOG)
East wells are deeper than in the west.Well pressures are higher and the above slide shows the difference in improvement.This is important, as it does show geology with better well pressures respond more to increased source rock stimulation.Although the improvements in the west are not that great, the east is.One would expect EOG to drill more wells in its eastern leasehold.
![]()
(Source: EOG)
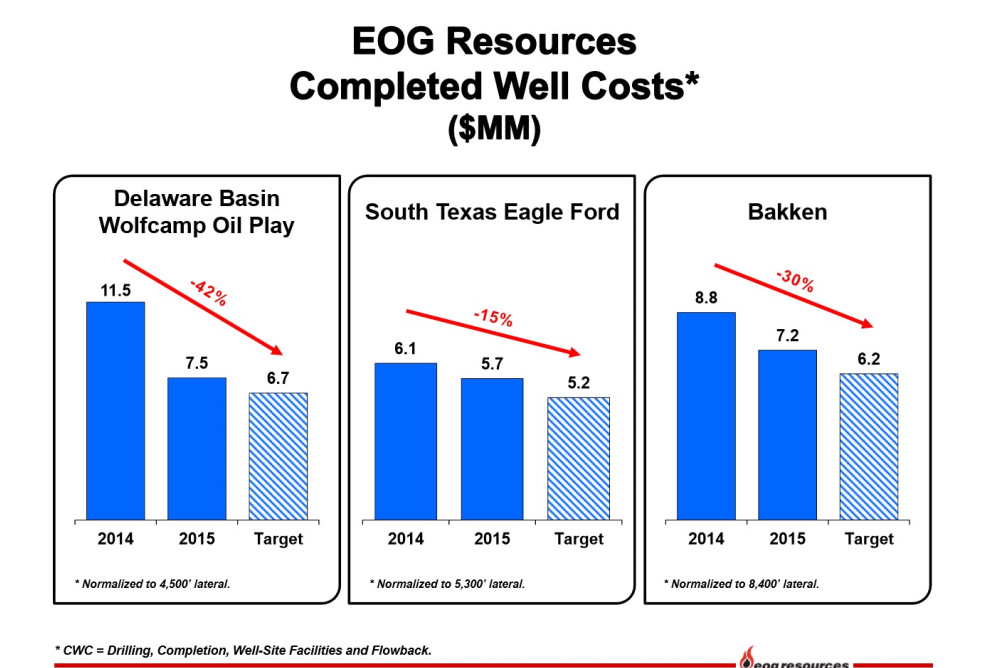
Well costs continue lower.In the Delaware a 42% improvement has been seen since 2014.The Eagle Ford is down 15% and the Bakken 30%.Drilling days continue to improve.This is some of the reason rig demand is down.The Delaware Basin is a newer play for EOG, and had higher initial well costs.The Bakken has seen logistical improvements, and operators focusing completions when the weather is warmer.These are just a few variables that helped each play decrease costs.The Eagle Ford is EOG’s flagship, so cost improvements haven’t been as great.It continues to increase proppant and fluids usage here.This may have also contributed to a lesser well cost improvement.
![]()
(Source: EOG)
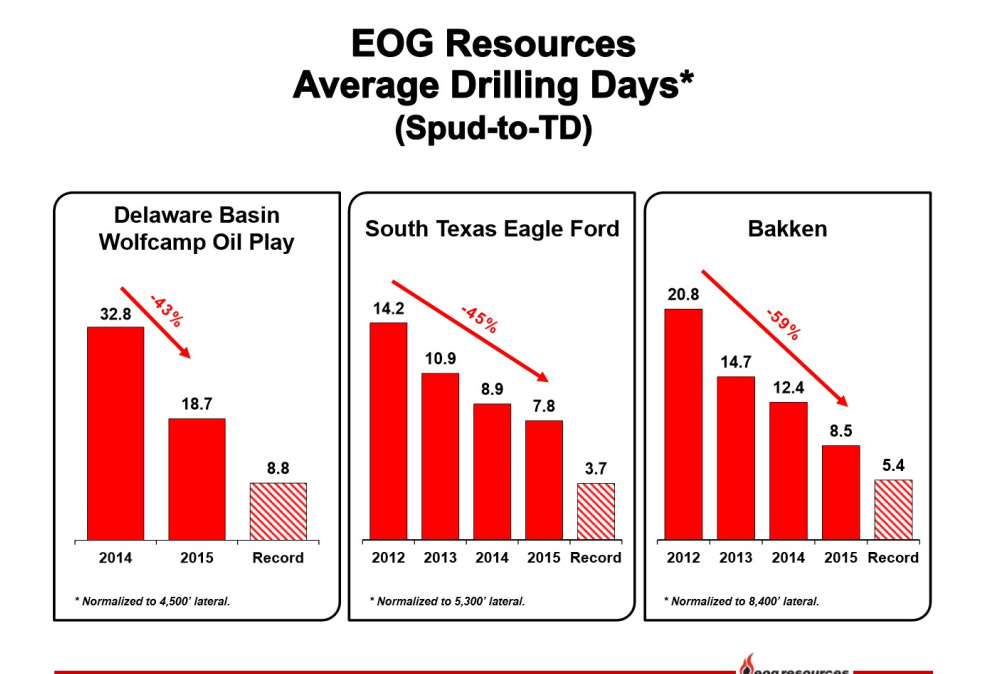
Decreases are seen from 43% to 59%.Productivity has been bolstered by pad drilling where the rig needs to move only a short distance.The move from exploration to development mode has improved costs significantly.Walking and sliding rigs also help to decrease time, but the 3.7 days needed to drill a well is crazy good.This is not the average, but once something has been done it will happen again.
![]()
(Source: EOG)
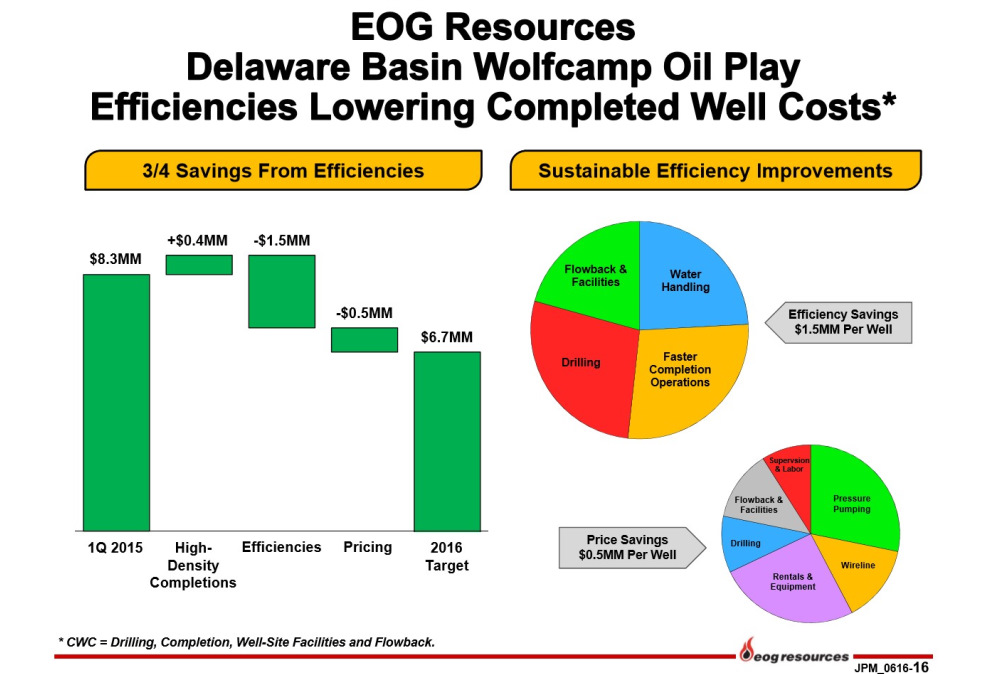
EOG does an excellent job of showing differences in well costs.The move to better well design only costs $400K/well.This increase is seen in frac fluids and frac sand usage.Another $2 million decrease in well costs have been seen.$1.5M is spread out between water, flowback, drilling and improved completion times.Of this $1.5M, about 60% is due to decreased costs associated with drilling and completion times.Water handling improvements have been seen through better logistics.Once pipe is in the ground a big savings is seen by not having to truck water to the pad.Another $500K has been realized through pressure pumping, wireline, rentals, drilling, flowback and labor.EOG isnt the only operator seeing improvements.Many are reporting the same improved economics.Operating costs also continue to improve.
![]()
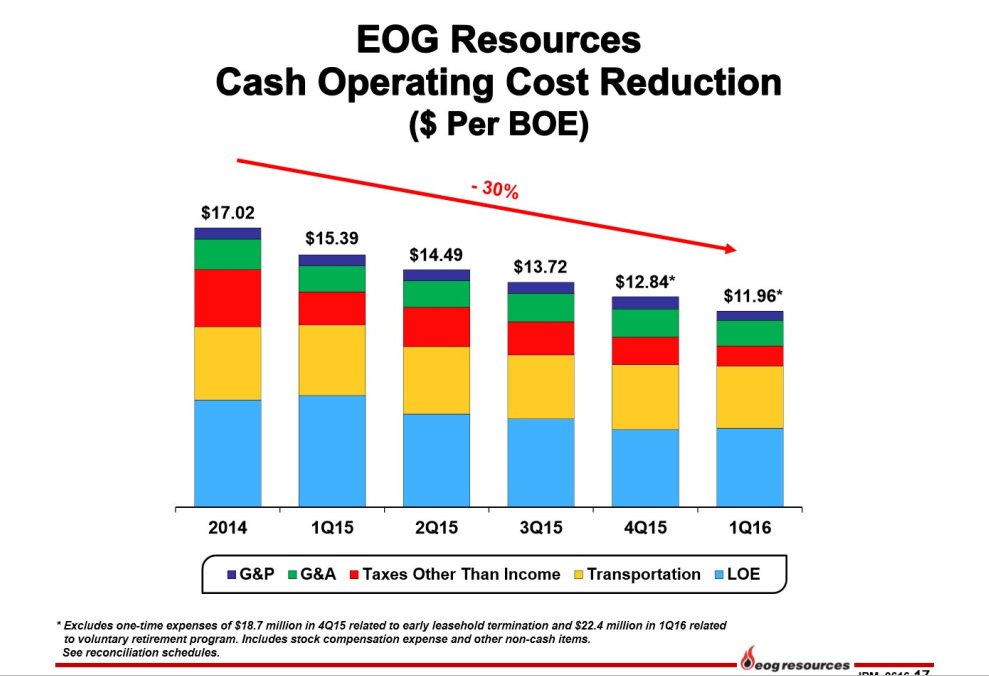
(Source: EOG)
A 30% improvement has been seen since 2014.If we compare cash operating costs of EOG with other operators in 2014, it is one of the best.Tax improvements have been very good, but operators continue to move production away from states like North Dakota where taxes are higher.We expect additional improvements before year end.
![]()
(Source: Pioneer)
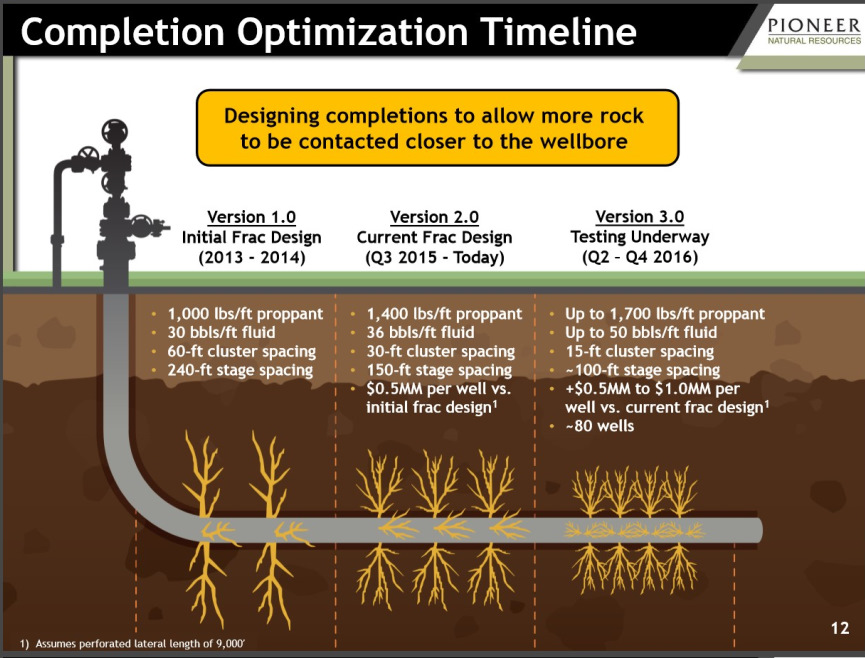
Pioneer (PXD) continues to improve well design and increase frac intensity.As you can see, it is focusing on fracs closer to the wellbore, but also is increasing the fracturing per foot.If we compare the design from 2013 proppant volumes are up 700 lbs/ft.Fluid volumes have increased by 20 bbls/ft.The spacing of entry points to fracture the source rock have moved from 60 feet to 15 feet.We are still in the early stages of improved fracs.We expect PXD and others are still seeing increased production through this design.
![]()
(Source: Pioneer)
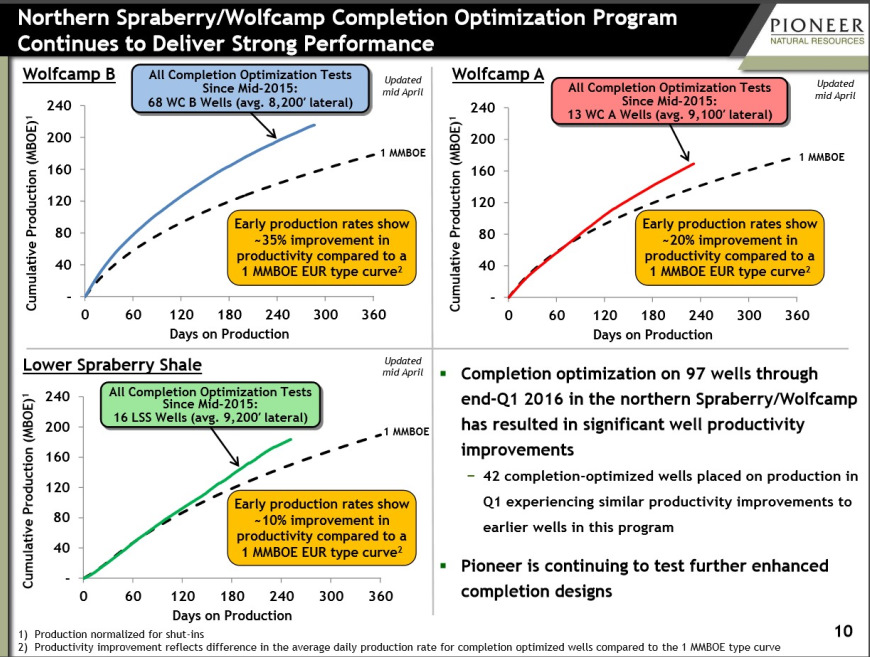
The problem with production results is we don’t know a well’s one-year data until one year has passed.So much of what I report is behind the curve, and not necessarily up to date.An operator can make relatively large improvements over just a few months, but we won’t know this until those months have passed. Operators get better with each well.It gets more comfortable with the geology, and creates a better well design.Each play is different, so there is no standard design.Each interval within that play also may respond differently.
The above slide shows the Wolfcamp B is now producing 35% better than its 1 MMBoe curve.EURs are not the best method of measuring well success.We don’t know what will happen over 30 years of well life, but more importantly wells can be re-fracced.But the EUR curve does provide a flow of production over the life of the well.In this case, it produced approximately 220MBoe in 300 days of production as opposed to the 1MMBoe curve of approximately 160MBoe.This is a significant uplift.The Wolfcamp A is doing 20% better.The lower Spraberry is 10% better.Using EURs to track production early in well life may be more appropriate.EURs are a starting point and usually behind the curve, as shown above.
![]()
(Source: Pioneer)
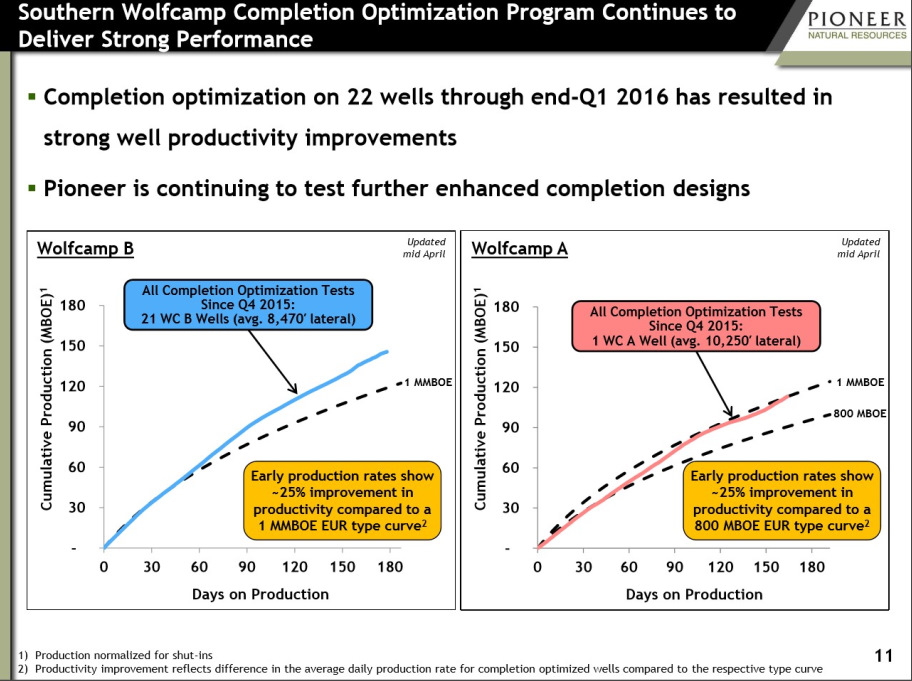
Pioneer’s southern acreage is also seeing an uplift.This is very important.If the southern Wolfcamp can also produce well at today’s prices, the core section of the play may be bigger than anyone currently realizes.The Wolfcamp A and B are both showing a 25% improvement.The Wolfcamp A is producing roughly 100 MBOE over 150 days, while the Wolfcamp B (north) is closer to 130 MBOE.Both averages are good, but the difference is quite large from a revenue standpoint.Since 4Q14, costs have improved significantly.
![]()
(Source: Pioneer)
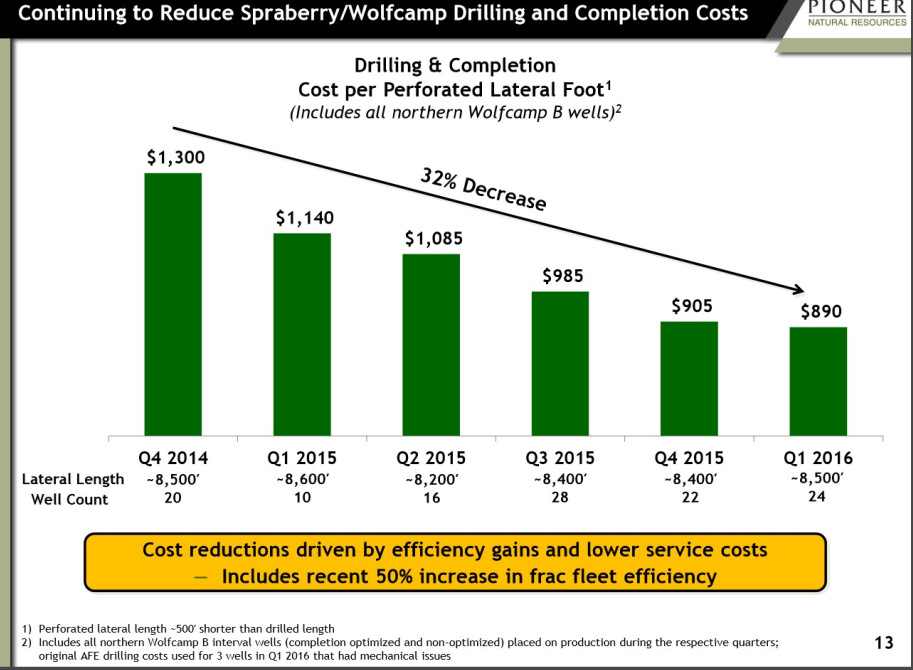
On a per foot basis, drilling and completion costs are down 32% as of Q1.Production costs have improved by 27% since 1Q15.Costs/foot are also a much better way to show improvements.Lateral lengths can change based on operator preference, but sometimes there are limitations based on leasehold.A good example would be EOG’s Parshall Field.It is limited in an ability to drill very many 2-mile laterals due to its early development.Pioneer’s frac fleet has improved efficiencies by 50%.Time is money, and each day saved can make a large difference to economics.
![]()
(Source: Pioneer)
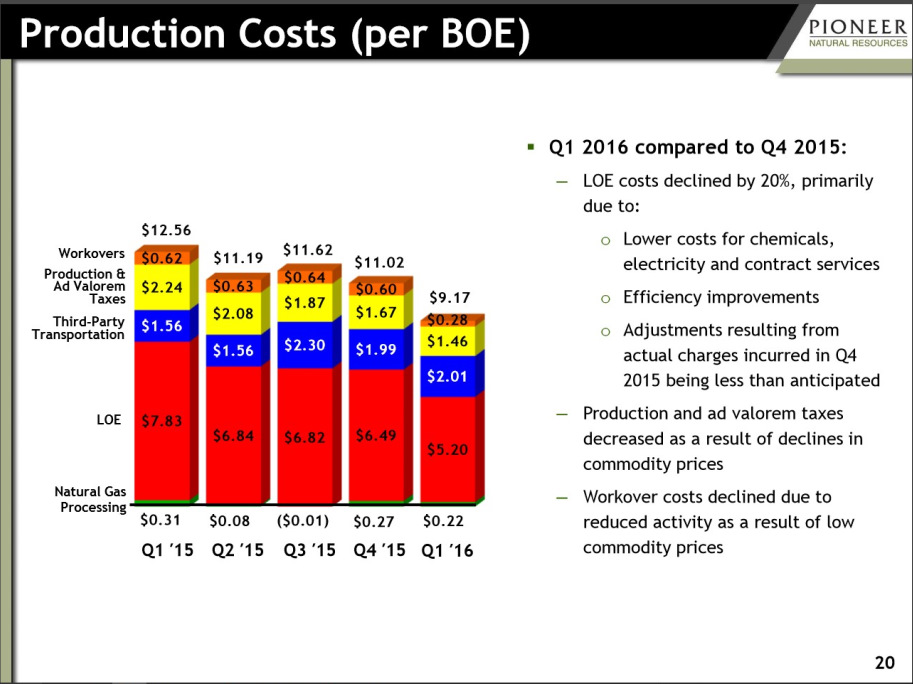
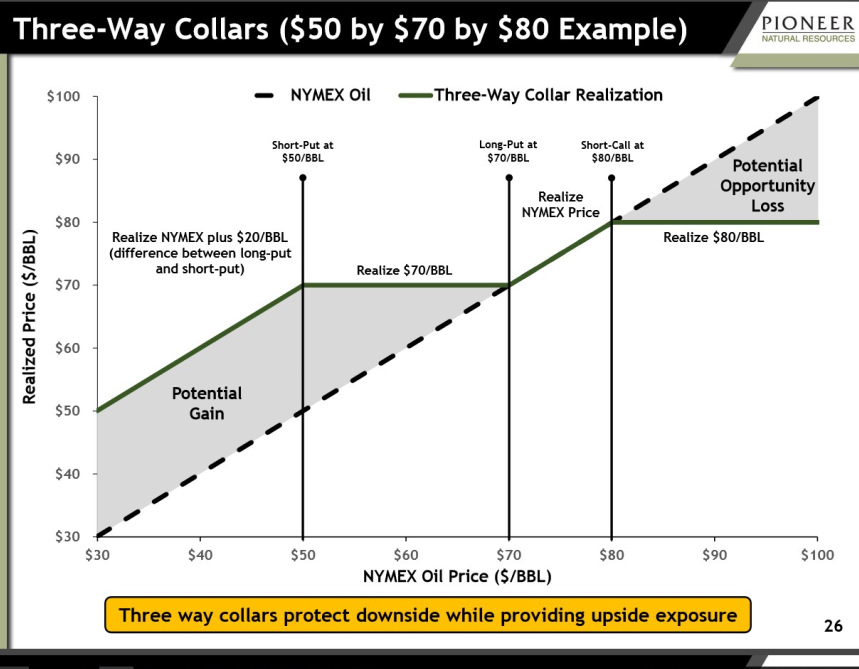
Although the decreases in costs are important, its total production costs are outstanding.At just $9.17/bbl., these costs are some of the lowest in unconventional oil and gas.It has decided to spend the majority of its cap ex in the Permian, but economics are better.Although this analysis is about well economics, I decided to add this for the purpose of showing the value of 3-way collars.
![]()
(Source: Pioneer)
I have received a large number of questions about 3-way collars and why operators choose to incorporate them.3-ways provide upside potential.Keep in mind, oil is one of the more volatile investments.In the above example, there are approximately $20/bbl above upside to oil until it hits $70.Although one would look at this protection as a hindrance, it does provide decent upside.Even if oil would drop to $30/bbl., PXD would still see $50/bbl.This would occur to $70/bbl.At this point, PXD would realize between $70 and $80/bbl depending on price.
This is part one of a series covering better well economics in the US.This refers to unconventional production, which is something many do not understand.In 2010, the industry looked to have little future even at higher oil prices.High costs and lower well production provided for poor economics.I have covered a very large number of articles covering production improvements in the Bakken, Permian, Eagle Ford, etc.These production improvements are just some of the reason the US is competitive at today’s oil price.Operators will not see the oil prices it once did, but as this improves so will well economics. Many companies have better contracts with oil service while improving drilling and completion times.It continues to cut costs making $50/bbl an economic price.
The industry will continue to improve, just as we have stated over the past several years.The major cuts to capex are going to be felt in world oil production.This could cause an oil price increase next year as we work through the oil glut.It is possible oil price estimates for next year are low, as the difference in world production and demand are minor.We expect demand will be very good as low prices will stimulate demand.This could be helpful to Europe and Japan whose economies are having difficulty growing.Canceled oil projects in concert with natural oil production declines may create a balance earlier than expected.This could mean better oil prices next year.It is also possible prices remain lower for longer, but only time will tell.Either way areas like the Permian and STACK can continue to produce.It is important to study a company’s production and cost structure before investing.These are two crucial variables in whether an operator can survive the downturn.
Data for the above article is provided by welldatabase.com. This article is limited to the dissemination of general information pertaining to its advisory services, together with access to additional ...
more

