
Bakken Update: EOG's Well Design Continues To Outpace In The Bakken
We have covered many of the best producing areas in the US. Although the Permian and STACK continues to outpace, there are many areas throughout the US that are productive at today's oil price. The Permian produces well at $50/bbl, while the Eagle Ford and Bakken core are closer to $55/bbl and $60/bbl. Wells in North Dakota may be economically better, but after taxes and logistics are backed out the Permian is the clear winner. Northeast McKenzie County has become the new Bakken core. At one time, nayesayers had suggested that Parshall Field was the best and no other areas would compete. We are finding well design improvements not only produce better results, but the decline curve has flattened substantially.
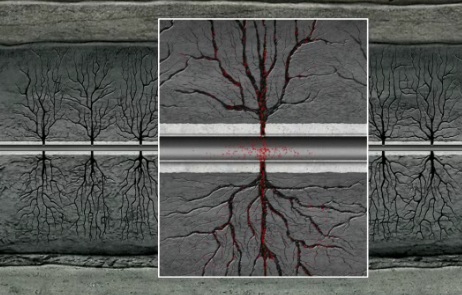
(Source: FracFocus)
In 2008 and 2009, EOG Resources (EOG) had production results in Parshall Field that were miles ahead of any other in the unconventional US. This includes operators like Whiting (WLL) and Newfield (NFX). Some thought EOG was opening up the choke. Many analysts thought these wells would end up producing the same volumes of oil as other wells, just more up front. The truth was EOG had learned how to create more, shorter frac's. Induced frac's are cracks or fissures created in rock to release oil and natural gas. The first operators focused on wide, long frac's which didn’t stay open and made it difficult to get proppant deep into the source rock. Proppant is either frac' sand, ceramic covered sand or ceramics. These are pushed into the fractures to "prop" open the frac's. This allows the oil and natural gas to continue flowing into the well bore. EOG was able to break up or crack the rock better and more resource would flow out. EOG's issue was keeping the resource flowing as much of the proppant did crush out and stop much of the flow that could have been produced. EOG's Mega-Frac' well design has evolved and we are seeing that production continue. We are also seeing significant initial production improvements. Other operators are duplicating the design, but EOG remains the leader.
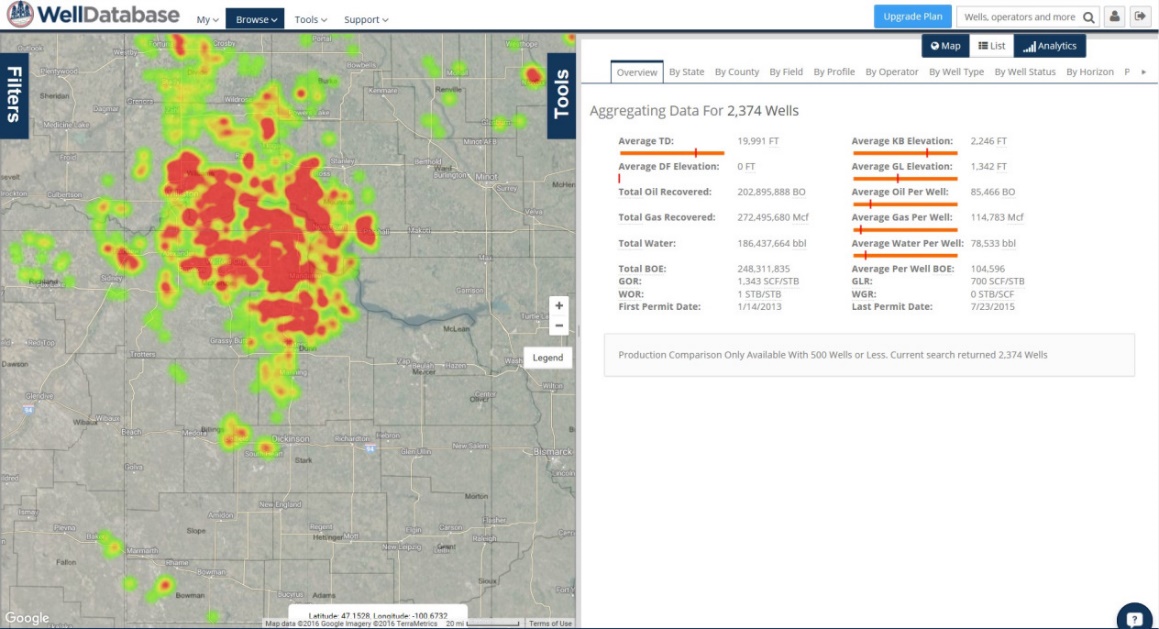
(Source: Welldatabase)
We pulled production data from all operators in NE McKenzie County. We used wells completed as of 9/1/14. Hess is by far the most active, but this is its main play. Burlington and XTO, also known as Exxon and Conoco also completed more than 100 wells.
|
Name |
Well Count |
CUM Gas [MCF] |
CUM Oil [BBL] |
CUM Water |
|
HESS BAKKEN INVESTMENTS II, LLC (NYSE: HES) |
163 |
27,044,136 |
15,763,976 |
3,878,455 |
|
BURLINGTON RESOURCES OIL & GAS (NYSE: COP) |
136 |
17,005,010 |
11,607,458 |
5,827,160 |
|
XTO ENERGY INC. (NYSE: XOM) |
118 |
13,243,808 |
8,259,651 |
4,418,433 |
|
QEP ENERGY COMPANY (NYSE: QEP) |
67 |
14,572,114 |
10,014,314 |
4,809,849 |
|
NEWFIELD PRODUCTION COMPANY (NYSE: NFX) |
45 |
7,977,050 |
3,764,285 |
1,513,779 |
|
PETRO-HUNT, L.L.C. |
31 |
8,117,341 |
3,648,731 |
952,205 |
|
CONTINENTAL RESOURCES, INC. |
28 |
5,824,109 |
3,259,706 |
1,572,202 |
|
WHITING OIL AND GAS CORP (NYSE: WLL) |
14 |
7,977,522 |
2,460,999 |
962,280 |
|
OASIS PETROLEUM NORTH AMERICA (NYSE: OAS) |
13 |
1,319,424 |
1,186,456 |
680,151 |
|
ENERPLUS RESOURCES USA CORP (NYSE: ERF) |
12 |
4,943,091 |
3,021,808 |
945,691 |
|
HRC OPERATING, LLC (NYSE: HK) |
11 |
1,935,136 |
1,880,374 |
1,409,263 |
|
SHD OIL & GAS, LLC |
11 |
782,730 |
582,756 |
452,681 |
|
ABRAXAS PETROLEUM CORP. (NASDAQ: AXAS) |
10 |
1,561,940 |
800,104 |
533,694 |
|
WPX ENERGY WILLISTON, LLC (NYSE: WPX) |
6 |
1,150,667 |
997,070 |
472,358 |
|
EOG RESOURCES, INC. |
6 |
1,755,604 |
907,568 |
848,977 |
|
MARATHON OIL COMPANY (NYSE: MRO) |
5 |
658,063 |
539,332 |
145,783 |
|
WHITE BUTTE OIL OPERATIONS, LLC |
3 |
282,715 |
193,554 |
73,082 |
|
SINCLAIR OIL & GAS COMPANY |
2 |
146,276 |
93,766 |
92,873 |
|
SLAWSON EXPLORATION COMPANY, INC. |
1 |
152,685 |
113,297 |
41,483 |
(Source: Welldatabase.com)
Total production is not as important as production per well. Sometimes total production can skew data, as the average investor thinks more wells mean more profits. Nothing could be farther from the truth. EOG has not been as active in ND, but its wells in the Eagle Ford produce better. EOG has moved rigs from ND due to economics. Much of this is due to differentials and taxes. It use to be able to forego differentials by railing crude to Louisiana to get a better selling price. That differential no longer exists, so it has turned development to areas that are more productive at lower oil prices.
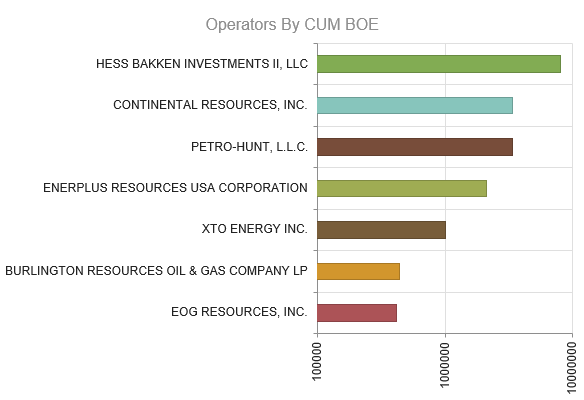
(Source: Welldatabase.com)
Although EOG only completed 6 wells, it did quite well from a cumulative BOE perspective. Keep in mind we are comparing this to more than 100 wells by several operators. Continental also did quite well. It has moved from sliding sleeve completions which limit access points to the source rock. It is used because of cost, but production is lower. Sliding sleeves are also much faster, but many of these wells will need to be re-frac'ed at some point. QEP is another name to watch, as its Grail Field wells have been excellent. This includes the middle Bakken, and three benches of the Three Forks. It is possible that QEP will be able to complete up to 18 wells per section. Northeast McKenzie County is unique. This is one of the few places in North Dakota where the Three Forks outperforms. It provides a large number of wells over at least 3 payzones.
|
Operator |
EUR (BO) |
Total Months |
Recovered Oil |
Months Produced |
Remaining Recoveries |
Remaining Months |
|
HES |
220,700 |
59 |
134,789 |
23 |
85,911 |
36 |
|
CLR |
365,185 |
60 |
169,674 |
24 |
195,512 |
36 |
|
Petro-Hunt |
304,504 |
62 |
179,552 |
25 |
124,951 |
37 |
|
XOM |
184,260 |
59 |
108,976 |
23 |
75,284 |
36 |
|
ERF |
484,192 |
57 |
344,088 |
21 |
140,104 |
36 |
|
COP |
181,459 |
59 |
140,428 |
23 |
41,032 |
36 |
|
EOG |
567,286 |
50 |
408,610 |
14 |
158,676 |
36 |
(Source: Welldatabase.com)
Out of the top 20 producers in NE McKenzie, we took 7 to analyze results. We chose randomly, but did want to include EOG since its wells produce more resource. We provided the current average recoveries for all the wells analyzed above. Using a hyperbolic decline extending production three years a EUR was developed. An EUR is the estimated ultimate recovery. So the EUR listed is how many barrels of oil will be produced as a rough estimate over the designated time frame. Each operator had differing start times, so this varied from 50 to 62 months. These wells will produce more, and the hyperbolic decline is probably greater than what will actually happen. So these results are conservative. While EOG had an EUR of 567,286 BO, the closest operator was ERF with 484,192. ERF's estimate is with an additional 7 months of production. Conoco's average over 59 months was just 181,459 per well.
In summary, EOG's well design in the new Bakken core is a big outperformer. Other operators are getting better, but it continues to be another case of follow the leader. EOG is showing us how much better well design can become. EOG is responsible for many of the improvements seen today, and its innovations will continue to effect the way we produce oil and natural gas. EOG self sources the majority of its sand which has aided in the development in this design. When frac sand prices skyrocketed, it was able to keep those costs down. All operators are moving the plug and perf with perf clusters spaced tightly. We expect a large improvement in other E&Ps. Not only will it produce more resource per well, it should continue to decrease breakevens.
Data for the above article is provided by welldatabase.com. This article is limited to the dissemination of general information pertaining to its advisory services, together with access to additional ...
more

