
Weekly Wrap: With This Market, The Devil Is In The Details
This week the yield of the 10-year Treasury reached over 3.12%, a level not seen since 2011 and the 2-year rose over 2.5%, to levels last seen in 2008. The spread between the 2-year (2.573%) and the 30-year Treasury yield (3.246%) remains near multi-year lows. With the market pricing in a more than 50% likelihood of three additional 25 basis point rate hikes by the end of the year, up from 33% just a month ago, the potential for an inverted yield curve in 2018 is a material possibility. Looking at the charts for the 10-year, the next potential upside targets are around 3.75% and 4.0%, the peaks formed from 2011 to 2010.
The rising yields are a headwind to rate sensitive sectors such as real estate and utilities, causing the iShares US Real Estate ETF (IYR) to fall -3.5% over the prior five trading days as of Thursday close and the Dow Jones All Equity All REIT Index (REI) lost 3.0%. The Utilities Select Sector SPDR ETF (XLU) was the second worst performer, down -2.6%. While the rate sensitive shares were punished, growth stocks were back in fashion as the iShares Nasdaq Biotechnology ETF (IBB) gained 3.7% for the week, followed by the Energy Select Sector SPDR (XLE), up 2.8%.
Rising rates have seen the dollar continue to strengthen with the Amex Dollar Index (DXY) up 5.7%, (as of mid-day Friday) since its mid-February lows. This has helped small cap stocks, whose revenue is primarily domestic, outperform the large cap S&P 500, that generates roughly 60% of revenue internationally, by 5.56% since the DXY bottomed out. In fact, the S&P 500 SmallCap iShares ETF (IJR) has been the only major index ETF to record a 52-week high in May and has the strongest breadth indicators. Over the prior 5 trading days as of Thursday’s close, the Russell 2000 has continued to outperform, gaining 0.6% while the S&P 500 lost 0.1%, and the Nasdaq lost 0.3%.
Despite the lack of material progress over the last week, the S&P 500 has been able to move into the top of its downtrend channel and is within striking distance of its first “lower high” at 2,787 it reached after the correction began on January 26th, (a lower high refers to an interim peak within a downward slide). Breadth levels are improving with five cyclical sectors outperforming the overall S&P 500. That being said, according to the 10-day Advance/Decline line, the S&P 500 is slightly in overbought territory, which means more sideways moves are likely in store for a bit before any meaningful gains.
The Economy: Distilling the Mixed Signals Its Giving Us
While the stock market looks like it still has legs, the economy continues to give mixed signals, some improving and some degrading. Our view is that the longer-term indicators are flashing warnings signs, but we don’t see, barring any kind of geopolitical lunacy, material threats within the next quarter or two.
The Consumer
Retail sales for April rose 0.3%, matching consensus estimates, after a 0.8% increase in March that was stronger than initially reported. February’s numbers were also revised up from flat to an increase of 0.1%.Nine out of thirteen major retail categories showed increases, with Gasoline Stations gaining the most year-over-year, up 11.7%, up for nine consecutive months, marking the longest streak of gains since May 2011. Non-store retailers – such as our poster child for thematic investing, Amazon (AMZN) – coming in second place with 9.6% year-over-year gains. Since the end of the recession in June 2009, no other sector has seen more consistent growth in month-over-month sales than the non-store sector, gaining in 74% of all months. Not a surprise, given the accelerating shift by consumers to digital shopping. At the current pace, non-store’s share will likely overtake general merchandise category within a year. The three categories that have seen year-over-year loses are Department Stores, down -1.6%; Sporting Goods, hobby, books & music stores down -1.1%; and Health and Personal Care down -0.5%, all of which are victims of the shift to digital shopping. Just look at Amazon’s expanding Prime offering.
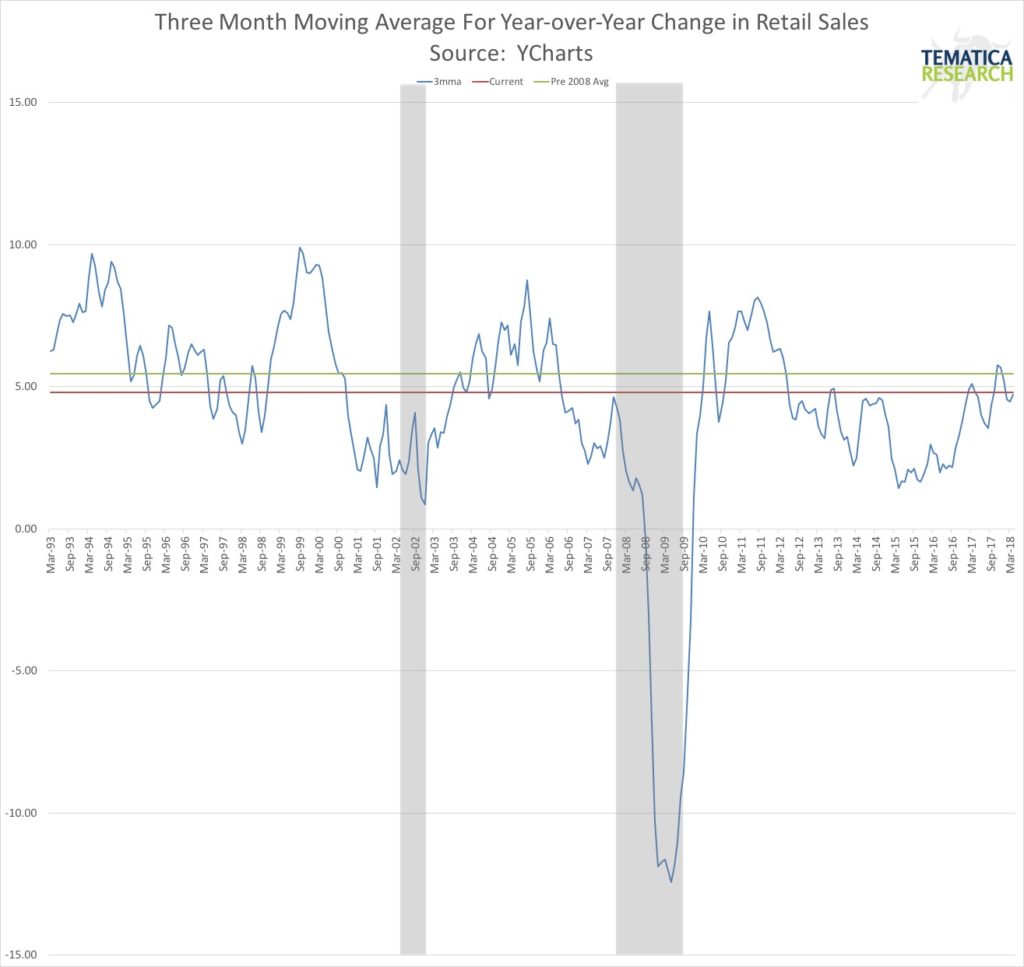
The chart below, which depicts the 3-month moving average for retail sales, shows that sales have definitely been improving over the past few years, but remain below the longer-term, pre-2008 average. In fact, retails sales have spent most of this second-to-longest economic growth period below that longer-term average, a testament to just how weak the recovery has been – difficult to get strong spending growth when households have too much debt relative to income and wage growth is tepid at best.
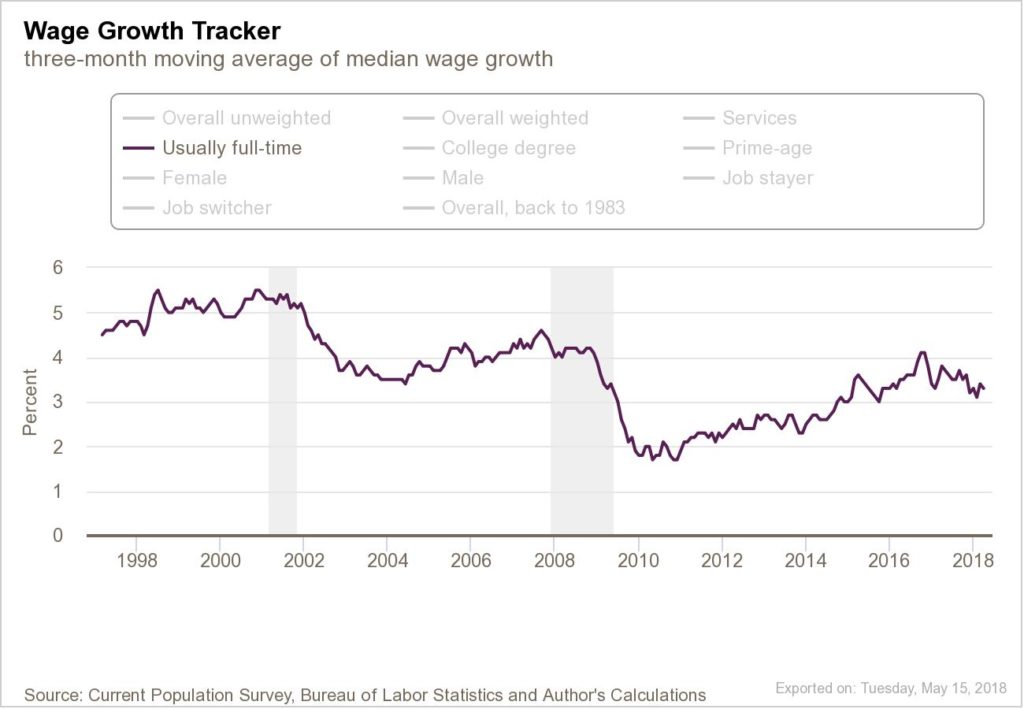
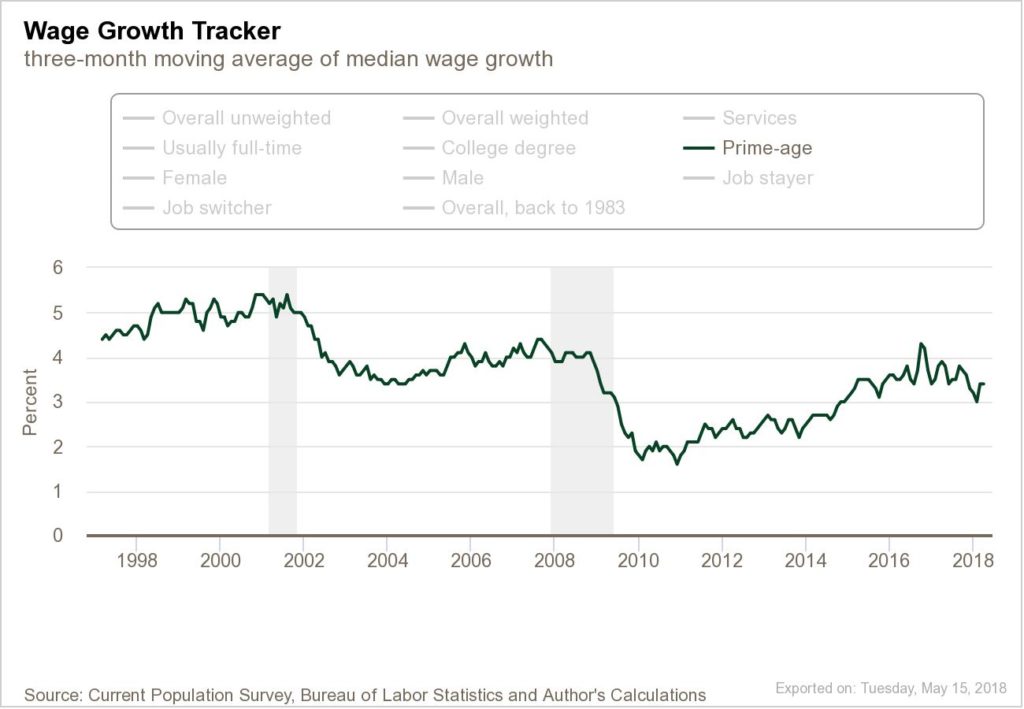
For consumer spending to increase, household incomes need to increase and/or household borrowing needs to increase. Despite the increasingly tight labor market, wage growth has actually been slowing recently. The following charts show that both overall average wage growth for usually full-time and the average wage growth for the prime working age population has been slowing.
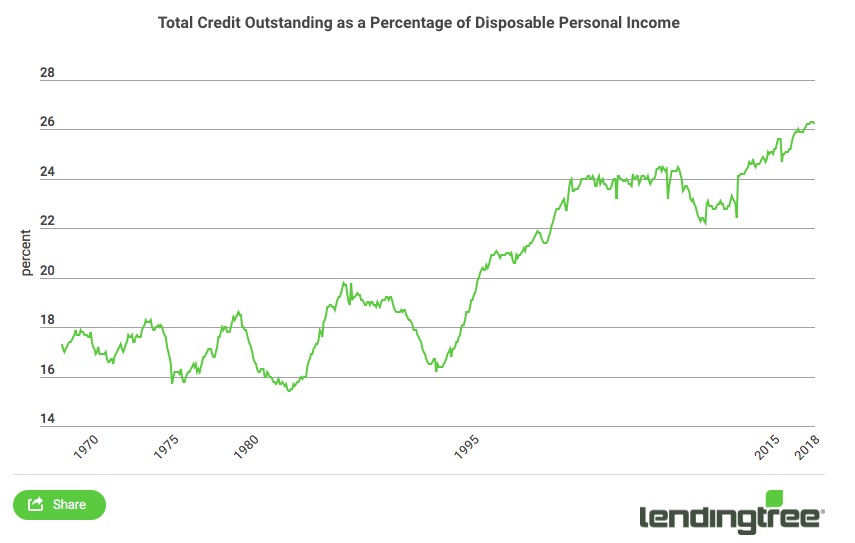
Other indicators for wage growth have been more positive, so this is something we will continue to keep a close eye on. The May 2018 Lending Tree Consumer Debt Outlook revealed that while incomes have been rising, household debt has been rising faster. Total outstanding consumer debt is now at a record high as 26.2% of disposable personal income.
Thursday, we got the New York Fed’s quarter recap of consumer debt levels which found that student loans continue to grow as a share of total consumer debt, now up to 10.7% of the total, a record high, while mortgage debt has bottomed out, having hit a record low of 67.4% in Q4 2016 and is now up to 67.7%. Mortgage delinquencies remain quite low, a good sign for household health, as the current to 90+ day delinquent transition rates continue to sit near the lowest levels on record. Conversely, delinquencies for auto loans continue to rise with the share of loans 90+ days delinquent up to 4.3%, the highest since Q1 2012 and not too much below the post-recession peak of 5.3% in Q4 2010.
On top of slowing wage growth and record high household debt levels, rising oil prices are taking more of household wallet share in the form of higher gas prices. Tematica’s Chief Investment Officer noted $2.96 per gallon was had as he traveled down the I-95 corridor. Put all three together and it is unlikely that we will see sustained acceleration in retail sales (ex-gasoline) growth rates.
Housing starts for April were weaker than expected, falling -3.7% versus 0.7% forecast, with the bulk of the decline attributed to the volatile multi-family component. The prior month was revised up to +3.6% from +1.9%, which makes the miss less painful. Digging into the details, single unit starts have gained very little since last October, rising just 1.4% (annualized) over that time which is right near stall speed. Permits were also weak, down -1.8%, which was better than the expected -2.1% decline.
Business
Businesses are facing rising costs from a variety of areas outside of impact of rising oil prices as surging trucking rates are squeezing margins. Coca-Cola (KO) recently reported a 20% year-over-year increase in freight expense. Procter & Gamble (PG), Hasbro, Inc. (HAS), Danone SA (DANOY), and Nestle SA (NSRGY) also reported higher transportation costs and Unilever PLC (UN) expects high single digit to high-teens increases in U.S. freight costs in the coming quarters. Universal Logistics Holding (ULH) reported a 12.7% increase in rates per mile on a year-over-year basis and demand continues to outpace supply. We see this driving further year over year growth in new heavy-duty truck orders, and thereby confirming the investment decision to add Paccar (PCAR) shares to the Tematica Investing Select List several months ago.
This week’s Empire Manufacturing report on activity in the New York Fed’s district headline index came in better than expected and found that prices paid hit their highest level since March 2011 – more margin pressure and the latest in a string of rising inflation data. The Philly Fed Manufacturing report also came in at 34.4, better than versus the expected 21.0 and last month’s 23.2. This was the 18th consecutive month that the headline index has come in above 20, which was never happened before as the prior record stood at 17 months. In addition, breadth was relatively strong with six categories rising and just three declining. The biggest gain came from New Orders with the biggest decline in Price Paid, in contrast to the Empire report.
Industrial production came in slightly above expectations, rising 0.7% in April versus the 0.6% forecast. March’s gain was also revised up by 0.2% as well. The business equipment category saw a +1.2% increase, the biggest so far this year. Business supplies also rose 0.4% as did construction supplies, up 0.3% and materials, up 0.5%.
The Bottom Line
The impact of tax reform may be kicking in as we see signs of increased investing. The lack of talent to fill the extraordinary number of job openings is a material headwind to growth. The lack of wage gains despite the ultra-low unemployment rate tells us that the underlying dynamics of the labor market are different from past expansions. That is a topic we will be covering in the weeks ahead.
We remain concerned with the level of debt across all three components of the economy – government, corporate and households. Rates are rising and debt levels across the board are high which increases the risk of dramatic price movement, yet so many of those Baby Boomers heading into retirement have had to take on high levels of risk in their portfolios to boost returns. While true even in normal times, this is a market in which one must increasingly pay close attention to its underpinnings.
The Week Ahead: May 21-25
Coming up next week we will get the April New Home Sales and Existing Home Sales reports. This two reports will give us additional insight after the slower-than-expected sales reported by Home Depot (HD) this week. We will also get more data around the state of the consumer with quarterly results from Kohl’s (KSS), TJX (TJX), Ross Stores (ROST), Big Lots (BIG), Target (TGT), Ralph Lauren (RL), Gap (GPS), Tiffany & Co. (TIF), and Williams Sonoma (WSM).
Next week we’ll also get the Richmond Fed and Kansas City Manufacturing Index reports to add more color to this week’s Empire and Philly and Industrial Production. Friday brings the Durable Goods report, which focuses mainly on higher-priced goods with an expected lifespan of three years or more, thus giving us insight into the confidence level of corporations and consumers with respect to the economy.
Disclosure: None.


We will see if Amazon can stay above the fray as other companies are trying to go their direction. Amazon has one thing they don't, a lucrative data warehousing business.