
Weekly Wrap: October Singing To The Same Tune
This week we learned that Mother Nature isn’t quite yet done with slapping the U.S. around. As California suffers through the most deadly wildfires in history, our hearts go out to all those affected. This has been a year to try the internal strength of many, but over on Wall Street, life is more like the ending of a Disney animation.
The second week of October sung essentially the same tune we’ve been boogieing to for much of the year:
- An unprecedented degree of calm pervades the market despite some seriously wacky stuff in the geopolitical
- While the economy continues to deliver a resounding ho-hum rate – neither tragedy nor victory
As of Friday’s close, 76% of the trading days when the CBOE S&P 500 Volatility Index (VIX) closed below 10 occurred just in 2017. Both the S&P 500 and the Dow Jones Industrial Average indices are on track for record or near record lows for average daily moves in 2017 – the hyper calm is becoming unnerving. The S&P 500 has now gone 235 trading days without a correction of more than 3%. The record is 241 days back in 1996 when the Federal Reserve was easing rates and the economy was a mere 4 years into the cycle versus today’s 8+ years and the Fed not only raising rates but embarking on Quantitative Tapering.
Most major indices ended the week relatively flat, while the SPDR Gold Shares ETF (GLD) has gained over 2% and the iShares 20+ Year Treasury Bond ETF (TLT) has gained just a little less than that. We are seeing the return of the mega-cap leads with the S&P 500 equal weight index underperforming the S&P 500 market cap weighted index as the FAANG trade of Facebook (FB), Amazon (AMZN), Apple (AAPL), Netflix (NFLX), and Alphabet (GOOGL) all outperforming the S&P 500 and the NASDAQ this week.
According to a weekly survey by the National Association of Active Investment Managers, the managers ranked as the most bearish are more than 90% long the market, versus typically having around a 93% net short position according to data going back to 2006. Today equity long/short hedge funds have built up their highest net-long exposure to the Russell 1000 since 2008.
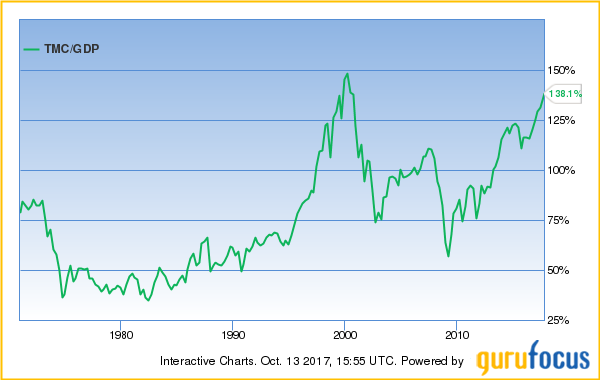
That’s a lot of bull going around. For a reference on just how all this fear-of-missing-out exuberance has affected the markets, take a gander at one of Warren Buffet’s favorite indicators – Total Market Capitalization versus U.S. GDP. The only time total market cap relative to GDP has been higher was during the dot-com bubble and today, we are well above the level reached prior to the financial crisis. This doesn’t exactly set the major indices up for enjoyable returns in the years to come.
The economic data this week continued to point to an economy that is in rather stark contrast with the ebullient market levels. We’d like to point out as we head into the 3Q earnings season that while EPS growth for the S&P 500 was 13.9% in the first quarter and 10.3% in the second, fiscal 2017 corporate tax receipts declined 1% year-over-year. The corporate Spanx of buybacks and non-GAAP earnings creativity strikes again.
While the week’s continuing jobless claims were the lowest since 1973, the JOLTS report (Job Openings and Labor Turnover Survey) from the Bureau of Labor Statistics revealed a few trends worth our attention. Job Openings fell to a 3-month low while New Hires and Voluntary Quits fell to 4-month lows. On the positive side, layoffs have declined for two consecutive months, but we continue to see a larger gap between quits and the unemployment rate than is normal, which indicates a labor market that isn’t quite what it ought to be.
Given the continuing record spread between job openings and hirings, which should indicate a tight labor market, the earnings report on Friday reiterated that not is all as it would seem in the labor market. Real average hourly earnings on a year-over-year basis rose a whopping 0.7%, but that is across a wide range of income levels. If we look at year-over-year changes in real average hourly wages for the vast majority, who fall into the production and non-supervisory category, that rose all of 0.2%. Ouch. That means that the rise in hourly earnings was mostly for those on the hirer end of the income spectrum. The monthly trend is also a cause for concern as September real average hourly earnings fell 0.1% after falling 0.2% in August.
No wonder retail sales disappointed, rising 1.6% versus expectations for 1.7%. Keeping in mind earnings growth, no shocker that growth in savings account balances today is the lowest since the recession. This is right in line with Citibank (C) and JP Morgan (JPM) boosting reserves for consumer loan losses by the most in over four years. Spending can only increase if household incomes rise or they borrow more. If it’s all about credit expansion, at some point household finances get ugly.
Friday’s CPI report revealed that the Federal Reserve’s inflation target remains elusive yet. We just can’t resist pointing out that the hawks in the Fed have been telling us for FIVE years that their targeted 2% inflation is just around the corner. Hope springs eternal? CPI was up 0.5% in September versus expectations for 0.6% increase and up 2.2% over the past 12 months on a seasonally adjusted basis. But… if we remove food and energy, (which is what the Fed is looking for) it is up just 1.7% for the fifth consecutive month – not exactly signaling acceleration now is it?
The bottom line is we continue to have a market priced at levels that are in the upper atmosphere of historical norms in an economy that continues to be “meh,” with income levels rising about as fast as a tortoise through molasses. We know full well that stock prices can get even headier from here, but beware of “reversion to the mean” for volatility and the reality of upside potential versus downside risk from such heights.
Disclosure: None.


