
Weekly Wrap: Navigating The Emerging New Market Dynamic
As we close the final trading day of the week, month, quarter and half year, what may have been the most astounding event from this past week, outside of the rockin’ and rollin’ on Wall Street, was the elimination of the reigning world champion Germany from the World Cup, courtesy of South Korea – it isn’t just the markets that have been a wild ride.
The Markets — Tech Stocks Take a Beating
This week the trade-war-induced market turbulence continued, but with a new twist as technology stocks got pulled into the battle. Investors had previously treated tech stocks as relatively immune, (which we’ve argued was incorrect) from the trade tirades between China, Europe, the US and Canada, which had left the Dow Jones Industrials down -0.6% for 2018 at the start of the week, while the tech-heavy Nasdaq was up over 11%. That changed this week with President Trump’s move to bar Chinese ownership of U.S. companies and ban some technology exports to China.
Monday a tech-centric stock selloff left the S&P 500 to close at its lowest level in June, down -1.4%, while the Nasdaq also closed down -2.1%, its worst day in nearly 2 months, and the Dow Jones Industrial Average fell -1.3%. The safety play returned with the Utilities sector gaining +1.7% while Consumer Discretionary slumped -2.2%. The talk of tech export bans and baring Chinese ownership of US companies pushed tech stocks such as Micron Technology (MU) down -6.9%, Autodesk (ADSK) down -5.0% and Nvidia (NVDA) down -4.7%.
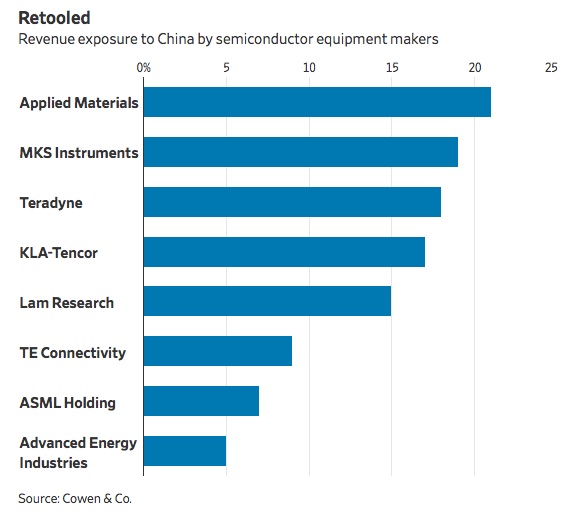
The flight to safety pushed the 10-year Treasury bond yield to 2.9%, its lowest since the end of May and commodities finished in the red as well, with copper making fresh 2018 lows, despite a weaker US Dollar, and the VIX jumped by 26% for its highest close since April. Chip manufacturers were also getting hit on talk of trade war, with companies like Applied Materials, Lam Research (LRCX), ASML Holding (ASML) and KLA-Tencor (KLAC) particularly vulnerable.
Monday a victim of our Clean Living investing theme made the headlines with the beleaguered Campbell Soup (CPB) gaining +9.4% on Monday on news that Kraft Heinz (KHC) is interested in acquiring it. CPB cut its earnings forecasts at least three times in the past 12 months, saw its CEO Denise Morrison abruptly retire and a strategic review kick off. Over the past year shares of CPB have fallen -21.2% while the S&P 500 has gained +11.4% – not exactly premium pricing at the moment. As consumers are becoming more and more focused on health-conscious products, CPB is looking at a long uphill battle to reinvent itself.
Tuesday the major indices recovered a wee bit (technical term), with the S&P 500 closing up +0.2%, the Russell 2000 outperformed again, closing up +0.7% and the Nasdaq sat in the middle, up +0.4%. Volatility rose as well, with the VIX closing up +3.0%. China’s Shanghai Composite continued to fall on the tit-for-tat trade war barbs.
Wednesday started off with the Dow leading a strong rally. By late morning it was up 286 points, but once again trade war talk sucked much of the enthusiasm out of the markets as White House economic advisor Larry Kudlow gave an interview on Fox Business.
“I believe that China is operating from a greater position of weakness than folks think. We are operating from a great position of economic strength.” – Larry Kudlow on Fox Business in the 11am ET hour
The Dow fell 453 points from the day’s peak, ultimately closing the day down 166 points, (-0.7%) to close below both its 50-day and 200-day moving averages. The S&P 500 lost -0.9% to close below its 50-day moving average and the Nasdaq lost -1.3% on rising volume. Semiconductors were the hardest hit within tech given their exposure to China, losing -1.3%. Nine of eleven sectors closed in the red, with just energy and utilities closing in positive territory. The US Dollar closed at a 52-week high and the 10-year Treasury yield fell 5 bps to 2.82%, the lowest level in a month.
Thursday each of the major indices managed to close in the green, with the Nasdaq up +0.8%, the S&P 500 up +0.6% and the Dow up +0.4%. Year-to-date as of Thursday’s close the S&P 500 is fairly flat, up +1.6% while the tech-heavy Nasdaq is up +8.7% but the Dow is down, losing 2.0%.
As of Thursday’s US market close, the MSCI World index is now below its 50-day, 100-day and 200-day moving average and down -7.5% from its January 2018 high. The spread between the 10-year and the 2-year Treasury rate is 31 basis points, versus 50 at the start of the year, 129 at the end of 2016 and 266 at the end of 2013 – talk about flattening.
US Dollar continues to strengthen which, coupled with the Fed raising interest rates on top of increased protectionism, is leading to tighter financial conditions.
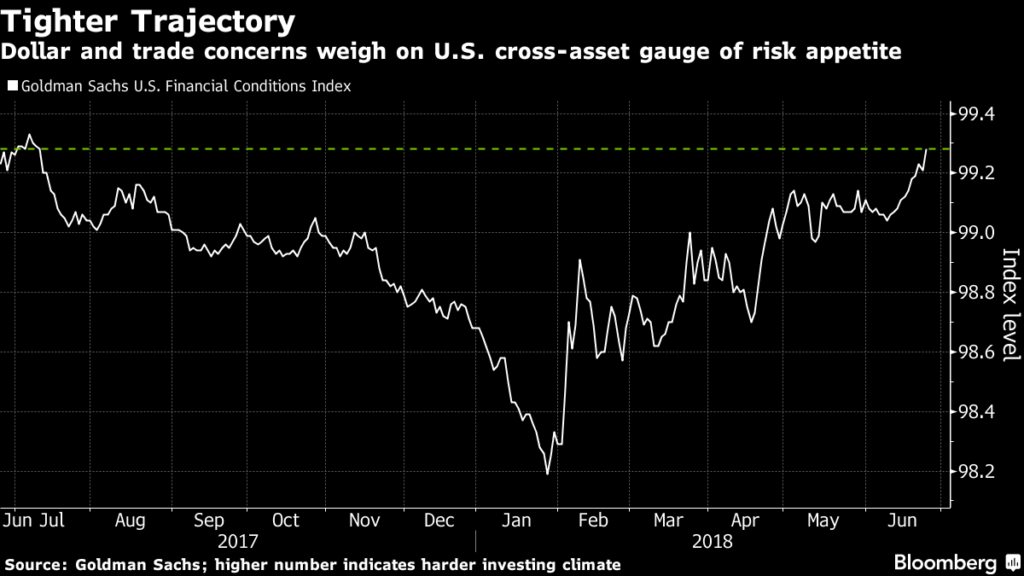
The widening rate differentials, (differences in interest rates) between the US and other countries provides a strong tailwind to a strengthening dollar as international investors can look to benefit from not only higher interest rates in the US, but potentially currency appreciation as well.
- The Chinese yuan has been falling since mid-April, falling -3.7% and dropping to its lowest level since early January.
- The Indian rupee has hit a record low against the dollar according to Bloomberg pricing data going back to January 3, 1973. So far this year the rupee has declined by -7.4% versus the dollar.
The Economy — Disconnect Between Expectations and Reality Continues
The final revision of Q1 GDP was revised down to just +2.0% from +2.2%, partially due to weaker-than-expected consumer spending. Q2 expectations are all over the map from even the Federal Reserve itself, with the Atlanta Fed’s GDPNow forecasting +4.5% while the NY Fed Nowcast is at +2.9%.
This week the Case-Shiller 20-City Composite Home Price Index showed that year-over-year price appreciation is slowing. The index rose 6.6% versus expectations for 6.8%. This is likely driven by two factors: mortgage rates that have risen to their highest level in around four years and slowing wage growth.
Home prices cannot continue to rise 6% – 7% a year when wage growth is less than half of that, which we see as fostering weaker demand in keeping with our Middle-Class Squeeze investing theme,as we discussed in last week’s Weekly Wrap. This week we also received Pending Home Sales from the National Association of Realtors, which saw sales slow for the fifth consecutive month, falling -0.5% from April and -2.8% year-over-year. The share price of Lending Tree (TREE), which derived 45% percent of revenue from mortgage products in 2017 has fallen a whopping 47.8% from its January high after having returned +235.9%, +13.52% and +84.7% in 2017, 2016 and 2015 respectively, revealing an awful lot about what going on with mortgages. And for those not following closely, there is the fact that homebuilding stocks are down more than 20% from their highs.
Last week we also discussed the disconnect between the Philadelphia Fed manufacturing index which fell to a nineteen-month low and the Empire State factory index which hit an eight-month high. This week the Richmond Fed regional manufacturing index came in stronger than expected at 20 versus expectations for 15. Still below its high of 30 during this business cycle, but a strong result. More importantly, the New Orders Index came in quite strong, rising from +16 to +22. The report found that prices paid has risen to the highest level in six years, which also appeared in the Philly Fed non-manufacturing report, with those costs being passed on to their customers – more signs of inflation that should keep the Fed on its path to higher interest rates. The main drivers of rising costs have been construction materials and fuel/shipping. While manufacturing overall is looking strong, the rising dollar and the ongoing trade wars are sources of concern as the last time the dollar had a strong rally in 2015, US manufacturing sector experienced a recession.
In contrast, the data Durable Goods Orders was a disappointment, with New Orders and Shipment (ex-aircraft) slowing further. The expectation going into that report was that with a tighter labor market, higher capacity utilization rates and tax reform, we would see a significant increase in capital expenditures – so far nothing too exciting happening here. This could be trade-related, or perhaps they aren’t quite as confident about the coming years as the headlines and tweets emanating from Washington would have one believe.
In contemplating trade, let’s remember the United States remains more insulated from a trade shock than other countries as exports represent just 12% of US GDP. That’s the lowest share among the 35 members of the Organization for Economic Cooperation and Development (OECD), a group of industrialized countries. In contrast, trade represents 31% of Canadian GDP, 37% for Mexico and 44% in the European Union.
But here’s the thing — about $440 billion of US corporate profits are generated abroad, which translates into about 20% of earnings. These tariffs could easily have an impact on jobs in the US in areas ranging from the largest American producer of nails to domestic whiskey distillers, lobster dealers and even to cranberry and peanut farmers.
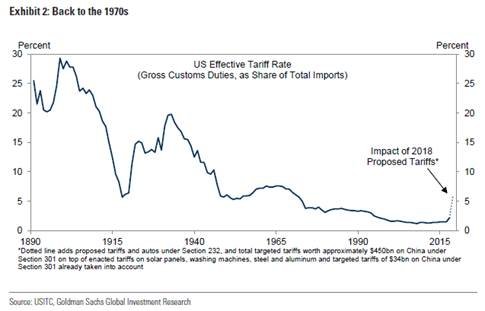
Pulling the US back to the tariffs rates we experience in the 1970's would likely mean the Federal Reserve may have to rethink its economic forecasts.
“Changes in trade policy could cause us to have to question the outlook.”
The Fed chairman, Jerome H. Powell at a European Central Bank conference in Portugal, June 20th, 2018
And here’s a great example of what I’m talking about — the US imports almost half of its consumption in the auto industry and currently has no spare capacity. Estimates published by the Peterson Group found that if these 25% tariffs are imposed, automotive industry production would be cut by 5% which would mean a 4% reduction in employment in the sector. This would mean overall lower vehicle sales and significantly higher prices – essentially the dynamics that we are seeing in new home sales.
While consumer confidence and expectations for the future, as measured by the Conference Board Consumer Confidence Index, remain near multi-year highs, both have been rather stagnant over the past year and may be rolling over. We’ve also seen a disconnect between expectations and consumption. Digging into the details on the latest report from the Conference Board, the expectations component fell to the lowest level of 2018 and experienced the sharpest pullback since December. Expectations for where business conditions would be between in six months dropped to the lowest level since September 2017.
Friday morning the Bureau of Economic Analysis reported on Personal Income and Outlays for May, which saw the Personal Consumption Expenditures (PCE) index rise +2.3% in the 12 months through May – the biggest gain in over six years. The core PCE Index, the Fed’s preferred inflation metric, rose +2.0% on an annual basis after gaining +1.8% in April. Consumer spending, on the other hand, was unchanged in May, when adjusted for inflation, after having increased 0.3% in April. Personal income growth matched expectations, rising 0.4% after gaining +0.2% in the prior month and the savings rate rose to +3.2% from +3.0% in April, potentially a sign that households are a bit less confident about their finances.
And then there is this — the Citibank Economic Surprise Index (CESI) has finally dropped into negative territory, having experienced a run of 188 trading days of positive readings – the longest such streak by 37 days in the 15-year history of the index. There have only been five other streaks of 100+ days in the history of the index. This index tracks the rate that US economic indicators come in better or worse than estimates over a rolling 3-month period. When indicators are better than expected, the CESI is in positive territory and when indicators disappoint, it is negative. The fact that it has rolled over makes intuitive sense given the Goldilocks expectations at the start of 2018 that haven’t quite been met by reality, which we’ve frequently discussed here. Bespoke Investment Management found that following the end of a 100+ day streak of positive CESI readings, the S&P 500 has averaged -0.3% and -0.8% returns for the next one and three months respectively. Six months later, returns were back in positive territory, up +2.9%on average.
The impact of our Disruptive Technology and Digital Lifestyle investing themes was evident in the first half of 2018, despite the trade war talk, as global M&A deals reached a record-setting $2.5 trillion, driven by a wave of megadeals led by US media and telecoms who are facing a powerful tide of digital disruptors. Volumes for the first six months of 2018 are 65% above the same period last year and the most, on a nominal basis, since Thomson Reuters started tracking the data in 1980. A record 35 deals were inked over $10 billion and another record 79 deals were closed above $5 billion. Disney (DIS) and Comcast (CMCSA) are in an intense bidding war for 21st Century Fox (FOX) and European broadcaster Sky as the two contend with increasing competition from Amazon (AMZN), which is part of Tematica’s Aging of the Population, Cleaning Living, Digital Lifestyle, Digital Infrastructure and Disruptive Technology investing themes, not to mention Alphabet (GOOGL) and Netflix (NFLX), which are both members of Tematica’s Digital Lifestyle theme.
Bottom Line — Realities of a New Market Dynamics
This is the final trading week of the month, the quarter and the half year, so the negative action we have seen likely indicates that portfolio managers are in a less bullish mood. With half of the companies in the S&P 500 in official correction mode, they have good reason to be concerned. We’ve now gone 106 trading days without the S&P 500 making a new high and volatility is on average nearly 50% higher in 2018 than in 2017 – this is a new market dynamic.
With an arguably overheating labor market, tightening monetary policy, a flattening yield curve and signs that economic activity is rolling over, we are (using historical norms) probably 18 to 24 months away from a recession. The recent tax cuts and higher government spending are likely to boost economic growth in the near term, but as fiscal stimulus fades and financial conditions continue to tighten, growth will face more headwinds.
This time really is different, as since WWII, the US government typically increased spending during downturns to soften the blows and pulled back during periods of low unemployment and improved growth. This time we are getting stimulus at a time when unemployment is at multi-decade lows – that’s new. We’ve also never had this level of debt in the world, nor have the world’s major central bankers ever engaged in such a coordinated effort to suppress interest rates and will be, by the end of this year, reversing the flow of liquidity.
Investors face the risk of stronger-than-expected economic growth as well as an overheating economy that is only made more complex by trade tensions that threaten to reduce global trade to where it was 4 to 5 decades ago on top of unprecedented monetary policy on a global level. Because we are in uncharted territory, investors need to be more flexible and disciplined, especially compared to the 13-month period following the 2016 presidential election.
Disclosure: None.


