
The Problem With Forecasts
We can’t predict the future – if it was actually possible fortune tellers would all win the lottery. They don’t, we can’t, and we aren’t going to try. However, this doesn’t stop the annual parade of Wall Street analysts from pegging 12-month price targets on the S&P 500 as if there was an actual science behind what is nothing more than a “WAG.” (Wild A** Guess).
In reality, all we can do is analyze what has happened in the past, weed through the noise of the present and try to discern the possible outcomes of the future.
The biggest single problem with Wall Street, both today and in the past, is the consistent disregard of the possibilities for unexpected, random events. In a 2010 study, by the McKinsey Group, they found that analysts have been persistently overly optimistic for 25 years. During the 25-year time frame, Wall Street analysts pegged earnings growth at 10-12% a year when in reality earnings grew at 6% which, as we have discussed in the past, is the growth rate of the economy.
Ed Yardeni published the two following charts which shows that analysts are always overly optimistic in their estimates.
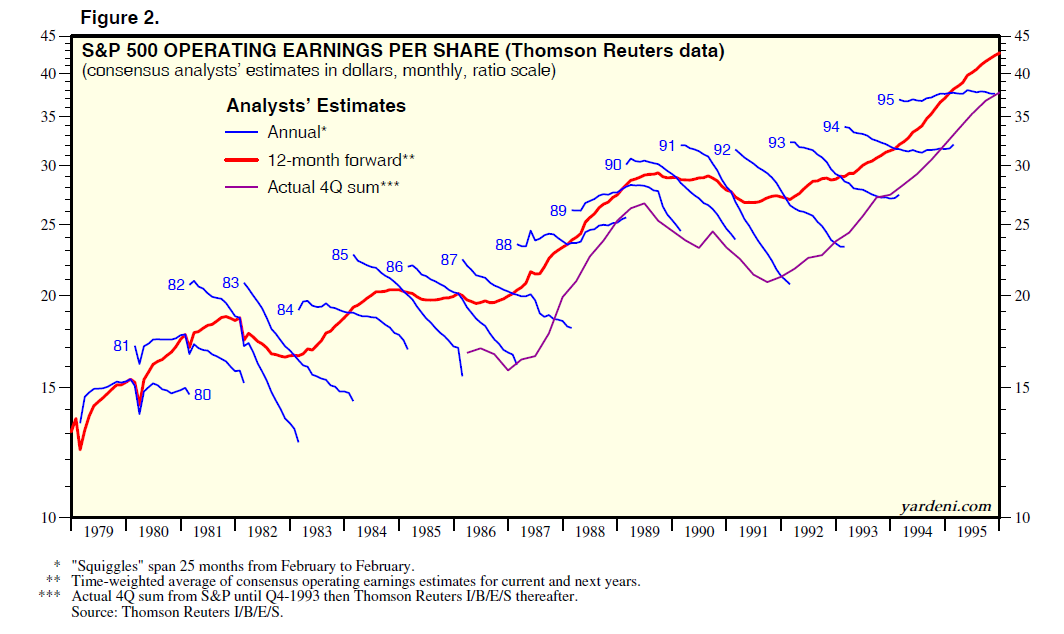
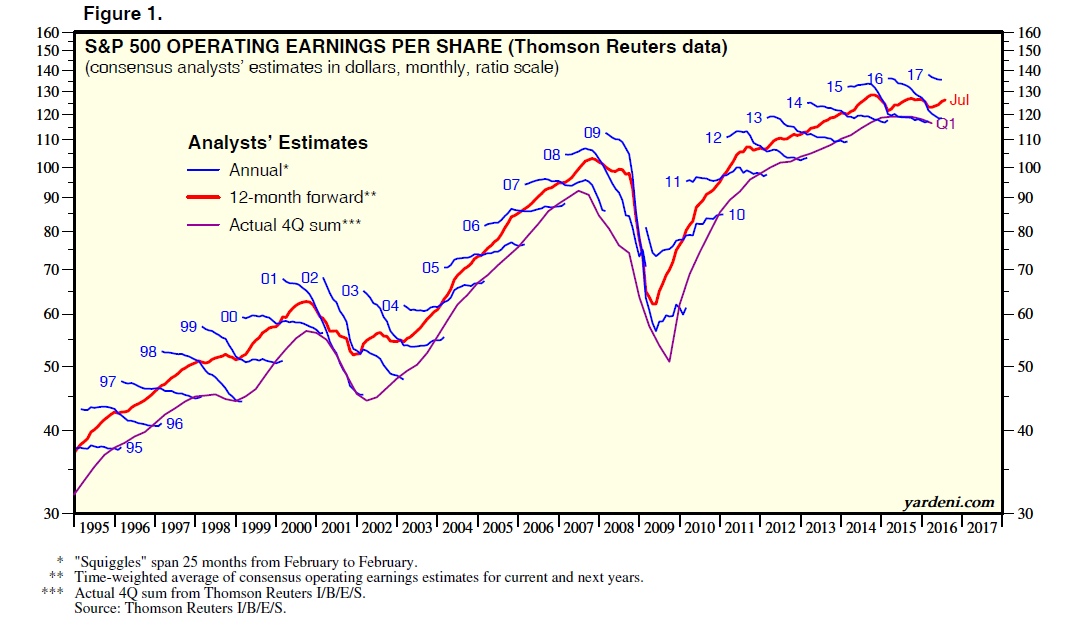
This is why using forward earnings estimates as a valuation metric is so incredibly flawed – as the estimates are always overly optimistic roughly 33% on average. Furthermore, the reason that earnings only grew at 6% over the last 25 years is because the companies that make up the stock market are a reflection of real economic growth. Stocks cannot outgrow the economy in the long term…remember that.
The McKenzie study noted that on average “analysts’ forecasts have been almost 100% too high” and this leads investors into making much more aggressive bets in the financial markets. Wall Street is a group of highly conflicted marketing and PR firms. Companies hire Wall Street to “market” for them so that their stock prices will rise and with executive pay tied to stock-based compensation you can understand their desire.
However, if analysts are bearish on the companies they cover – their access to information to the company they cover is cut off. This reduces fees from the company to the Wall Street firm hurting their revenue. Furthermore, Wall Street has to have a customer to sell their products to – that would be you.
Talk about conflicted. Just ask yourself WHY Wall Street spends BILLIONS of dollars each year in marketing and advertising trying to keep you invested at all times.
Since optimism is what sells products, it is not surprising, as we head into 2017, to see Wall Street’s average expectation ratcheted up another 4.7% this year. Of course, comparing your portfolio to the market is a major mistake to begin with.

As I wrote previously:
“Comparison is the cause of more unhappiness in the world than anything else. Perhaps it is inevitable that human beings as social animals have an urge to compare themselves with one another. Maybe it is just because we are all terminally insecure in some cosmic sense. Social comparison comes in many different guises. ‘Keeping up with the Joneses,’ is one well-known way.
If your boss gave you a Mercedes as a yearly bonus, you would be thrilled—right up until you found out everyone else in the office got two cars. Then you are ticked. But really, are you deprived of getting a Mercedes? Isn’t that enough?
Comparison-created unhappiness and insecurity is pervasive, judging from the amount of spam touting everything from weight-loss to plastic surgery. The basic principle seems to be that whatever we have is enough, until we see someone else who has more. Whatever the reason, comparison in financial markets can lead to remarkably bad decisions.
It is this ongoing measurement against some random benchmark index which remains the key reason why investors have trouble patiently sitting on their hands, letting whatever process they are comfortable with, work for them. They get waylaid by some comparison along the way and lose their focus. If you tell a client that they made 12% on their account, they are very pleased. If you subsequently inform them that “everyone else” made 14%, you have made them upset. The whole financial services industry, as it is constructed now, is predicated on making people upset so they will move their money around in a frenzy. Money in motion creates fees and commissions. The creation of more and more benchmarks and style boxes is nothing more than the creation of more things to COMPARE to, allowing clients to stay in a perpetual state of outrage.”
Focus on what is important to you, your goals and your money. In the end, this is why you started investing in the first place.
A Note On Risk Management
This is why I always focus on the management of risks. Greater returns are generated from the management of “risks” rather than the attempt to create returns. Although it may seem contradictory, embracing uncertainty reduces risk while denial increases it.
Another benefit of acknowledged uncertainty is it keeps you honest.
“A healthy respect for uncertainty and focus on probability drives you never to be satisfied with your conclusions.It keeps you moving forward to seek out more information, to question conventional thinking and to continually refine your judgments and understanding that difference between certainty and likelihood can make all the difference.”– Robert Rubin
The reality is that we can’t control outcomes; the most we can do is influence the probability of certain outcomes which is why the day to day management of risks and investing based on probabilities, rather than possibilities, is important not only to capital preservation but to investment success over time.
This Is Interesting
If you didn’t happen to read Friday’s reading list, I want to repeat this little blurb.
As I stated in the weekend newsletter entitle “Dow 20,000” the market was beginning to take on an eerily similar feeling:
“If this market rally seems eerily familiar, it’s because it is. If fact, the backdrop of the rally reminds me much of what was happening in 1999.
1999
- Fed was hiking rates as worries about inflationary pressures were present.
- Economic growth was improving
- Interest and inflation were rising
- Earnings were rising through the use of “new metrics,” share buybacks and an M&A spree. (Who can forget the market greats of Enron, Worldcom & Global Crossing)
- Stock market was beginning to go parabolic as exuberance exploded in a “can’t lose market.”
If you were around then, you will remember.”
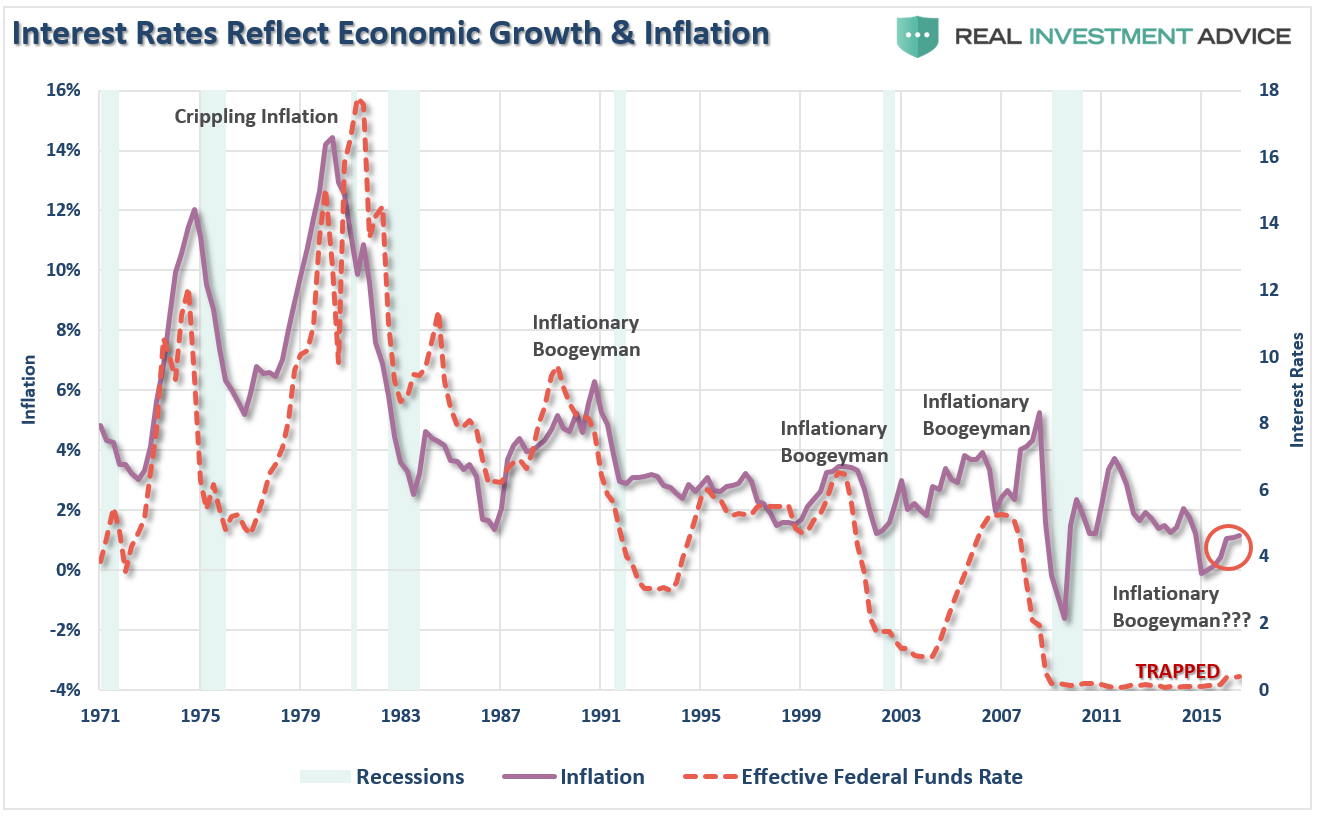
With Janet Yellen and the Fed once again chasing an imaginary inflation “bogeyman” (inflation is currently lower than any pre-recessionary period since the 1970’s) the tightening of monetary policy, with already weak economic growth, may once again prove problematic.
“But Lance, this is the most hated bull market ever?”
If price acceleration in the market is a sign of investor optimism, then the chart recently published by MarketWatch should raise some alarm bells.

The only other time in history where the Dow advanced 5000 points over a 24-month period was during the 1998-1999 period of “irrational exuberance” as the Fed was fighting the fears an inflationary advance, while valuations were rising and GDP growth rates were slowing.
Maybe it’s just coincidence.
Maybe “this time is different.”
Or it could just be the inevitable beginning of the ending of the current bull market cycle.
Decennial & Presidential Election Cycles
As I noted in last weekend’s newsletter we are heading into 2017 with:
- Markets pushing historic levels of extreme overbought conditions,
- 2nd highest levels of valuation on record,
- Extreme deviations from long-term growth trend lines,
- Investor sentiment and confidence pushing extreme bullishness,
- Investors fully committed to the market with low levels of cash, and;
- High levels of leverage in terms of margin debt and corporate debt.
In other words, after 8 straight years of a bull market advance, what is the risk you are taking to garner additional returns?

With markets pushing overbought, overvalued, and bullish extremes the future outcomes have not been terrific
However, what does the Decennial cycle have to say about 2017?
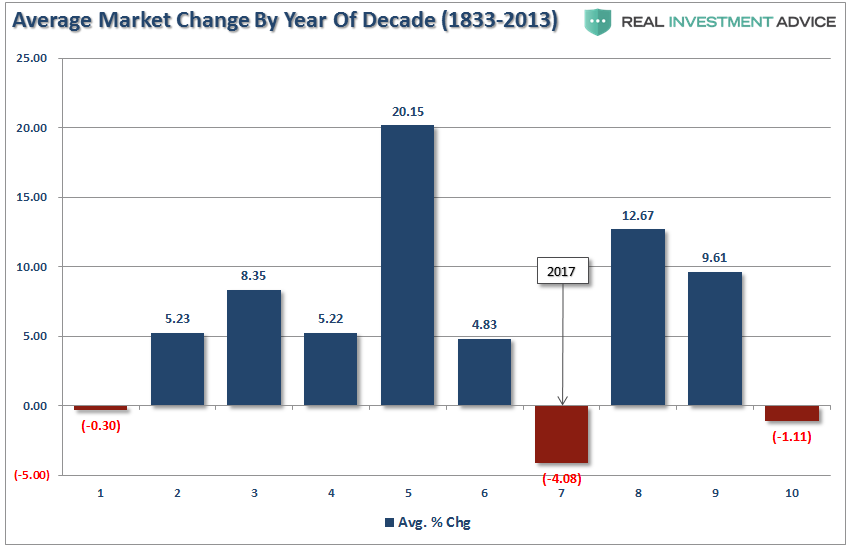
As we enter into the 7th year of the decade, what do the decennial trends tell us about the probabilities of stock market returns in the coming year? Here is the entire history back to 1833. Interestingly, you will note at the bottom of the chart the 7th year of the Decennial cycle is the WORST performing year of the decade.
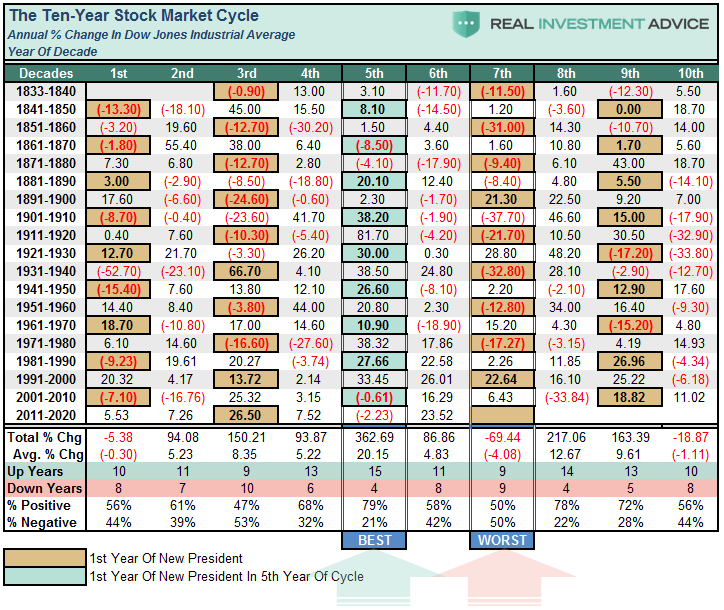
You will also note the 7th year of the decade has been negatively biased over its history turning in an average return of -4.08%. Furthermore, the negative return years matched the positive 9 to 9, or rather it was a coin flip (50/50) as to the outcome.
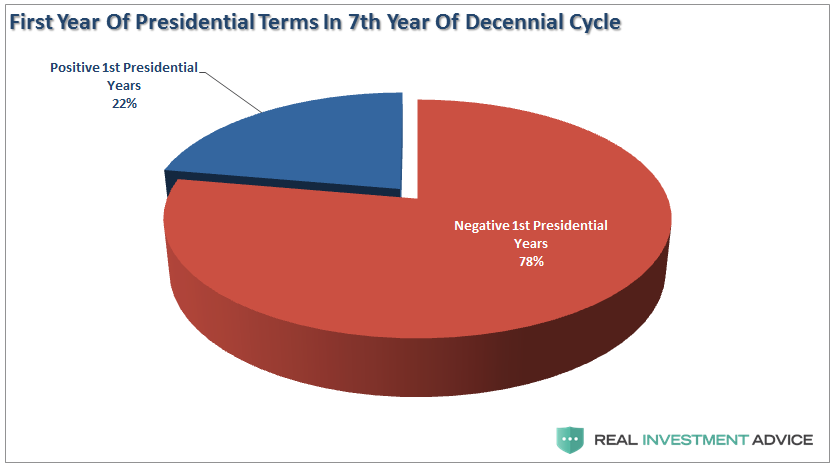
However, as noted by the highlights, the market has been NEGATIVE 7 of 9 times when the 7th year of the Decennial cycle coincided with the 1st year of a Presidential election cycle. Like this year.
With a win/loss ratio of 50%, the odds are equally balanced on the guess of an outcome.However, while the average return of an up year has been 11.29%, the average of down years has been a more damaging -20.29%.
Help From The Oval Office?
The stock market is also moving into the first year of the Presidential election cycle. With President Obama completing his final year of his term – the market, and the economy, are dealing with higher costs and taxes from the Affordable Care Act combined with reduced liquidity from the Federal Reserve. Furthermore, the ongoing debate and drama from Washington is unlikely to end soon, and fiscal policy will likely fall short of current expectations.
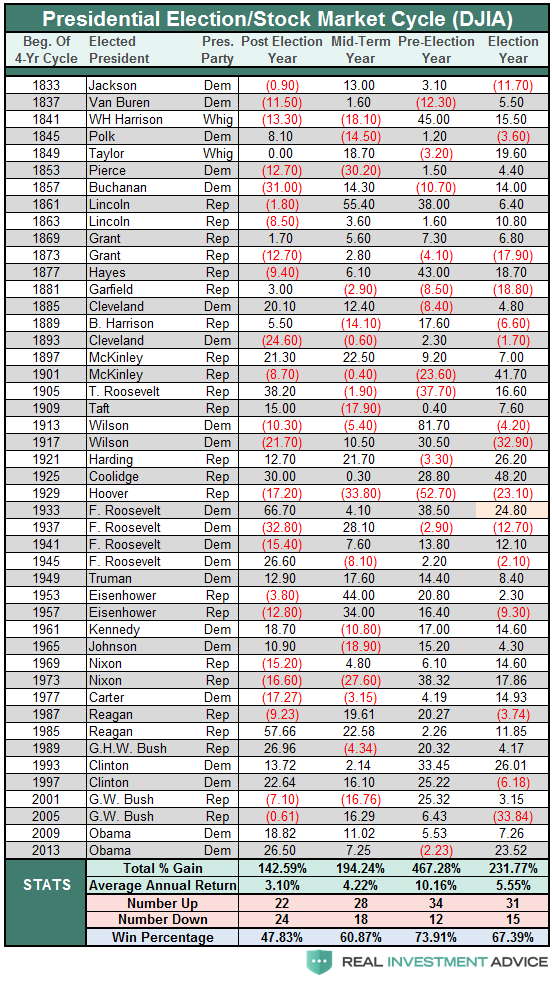
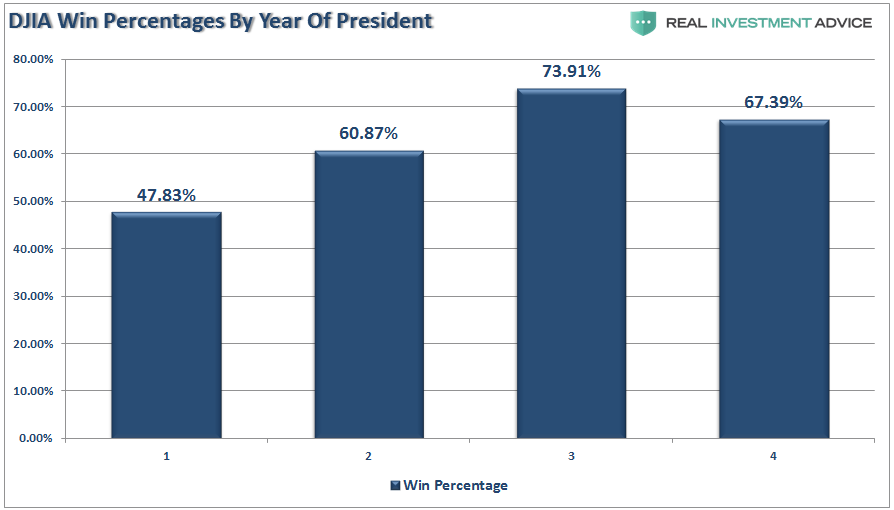
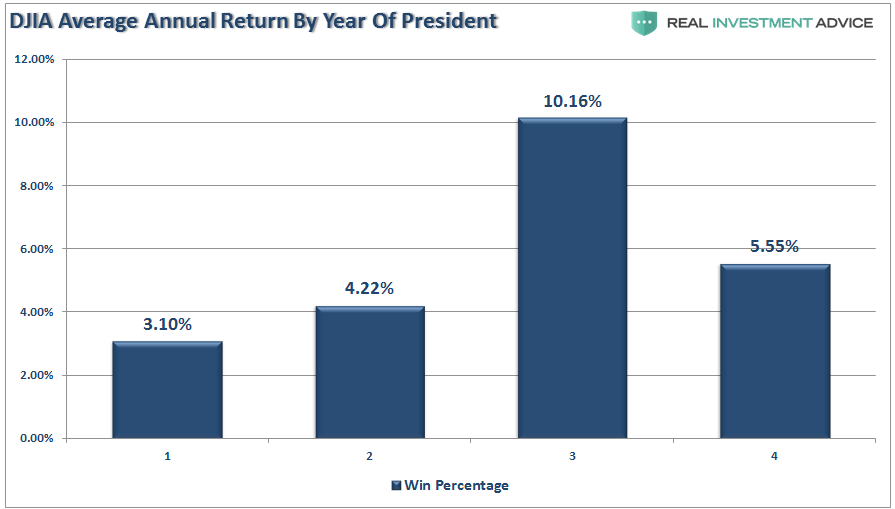
The good news is the first year of the President’s term sports an average return of 3.10%. However, the return has to tempered with just a 47.83% winning percentage. Since 1833 the market has been positive 22 out of 46 post-election years.
While the odds of a positive year in 2017 are more, or less, evenly balanced, one should not dismiss the potential for a decline. With the current market already well advanced and pushing overvaluation levels and extreme deviations from long-term means, the risk of a decline like outweighs the potential of a further advance.
I read most of the mainstream analyst’s predictions to get a gauge on the “consensus.” This year, more so than most, the outlook for 2017 is universally, and to some degree exuberantly, bullish.
What comes to mind is Bob Farrell’s Rule #9 which states:
“When everyone agrees…something else is bound to happen.”
The real economy is not supportive of asset prices at current levels and further elevations in prices increase the potential for a future market dislocation. For investors that are close to or in retirement, some consideration should be given to capital preservation over chasing potential market returns.
Will 2017 turn in another positive performance? Maybe. But, honestly, I don’t really know.
#PortfolioHedgesMatter
Market & Sector Analysis
Data Analysis Of The Market & Sectors For Traders
S&P 500 Tear Sheet

Sector Analysis
Comments
Almost, but no cigar. On Friday, the Dow Jones touched the magical 20,000 mark as prices rose this past week. As opposed to the last couple of weeks, this past week saw the S&P Index finish the week higher by 1.7% or 38.15 points.
The video below shows the historical “rotation” of sectors over the last 3-years. As you will notice sectors have consistently “swarmed” in a clockwise rotation going from strongly outperforming the S&P 500 index to strongly underperforming. If you watch to the end of the video you will see the post-presidential election anomaly form.
I have notated on the Sector Rotation model below, the early stages of the reversion process of that extreme with Treasury’s and Financial’s beginning to trade momentum.
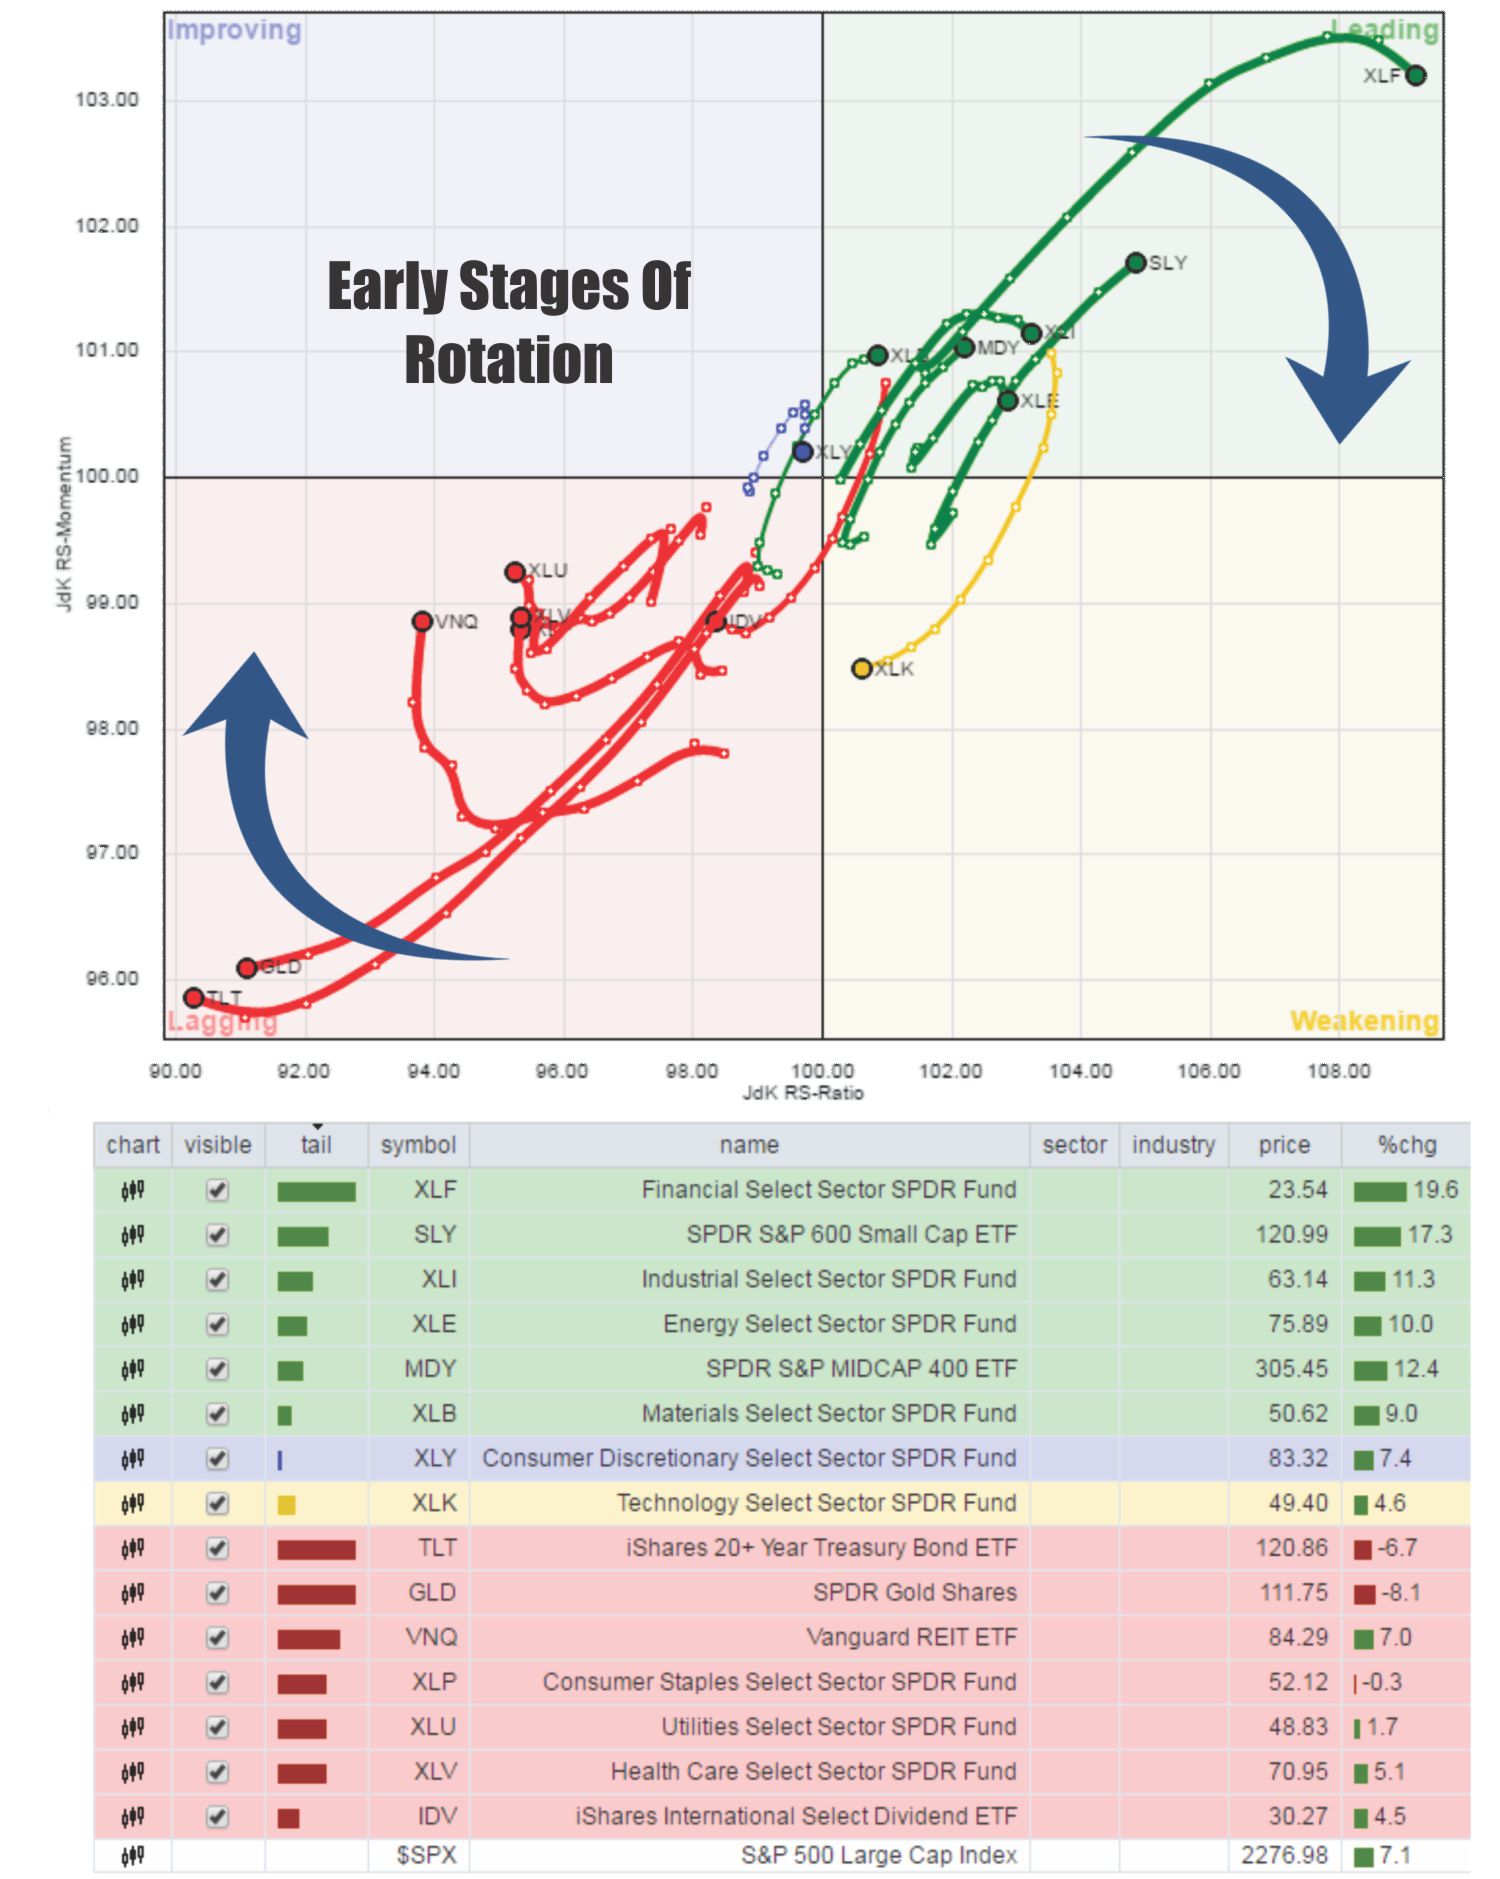
While Financials have continued to outperform the S&P overall, they remain extremely overbought. I have recommended taking profits and such recommendation remains this week. Small and Mid-cap stocks, Energy, Materials, and Industrials outperformed the index as well. The problem, as stated above, is that a stronger dollar and higher interest rates will likely hamper this optimism sooner rather than later. This is particularly the case with Small and Mid-Cap companies that are the most susceptible to monetary tightening.
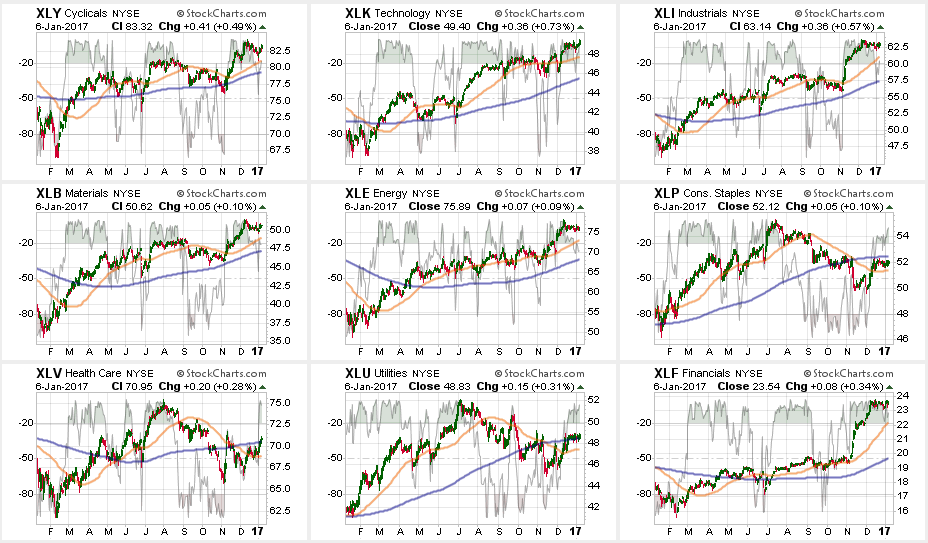
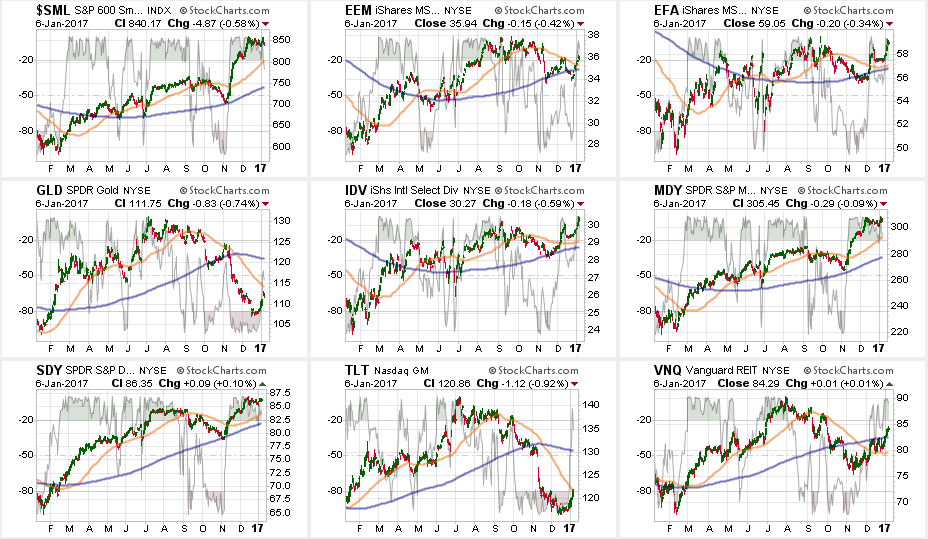
As shown below, Discretionary, Technology, Industrials, Materials, Energy, Staples & Financials have stagnated while Utilities and Health Care have picked up performance.
(Note: I have changed the sector and major market analysis charts to a 50/200 DMA crossover signal and embedded an overbought/sold indicator.)
The table below shows thoughts on specific actions related to the current market environment. (These are not recommendations or solicitations to take any action. This is for informational purposes only related to market extremes and contrarian positioning within portfolios. Use at your own risk and peril.)
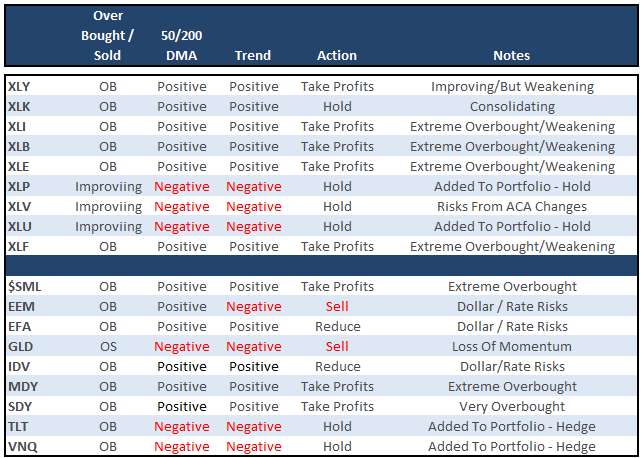
Three weeks ago, as suggested, we hedged our long-equity positions with deeply out-of-favor sectors of the market (Bonds, REIT’s, Staples, Utilities) which have continued to perform well in reducing overall portfolio volatility risk.
As I have been warning over the last couple of months, the stronger dollar and the rise in rates should not be dismissed.
Everything is currently pointing to this being a very late stage advance, so profit taking, hedging, and rebalancing is strongly advised.
THE REAL 401k PLAN MANAGER
The Real 401k Plan Manager – A Conservative Strategy For Long-Term Investors
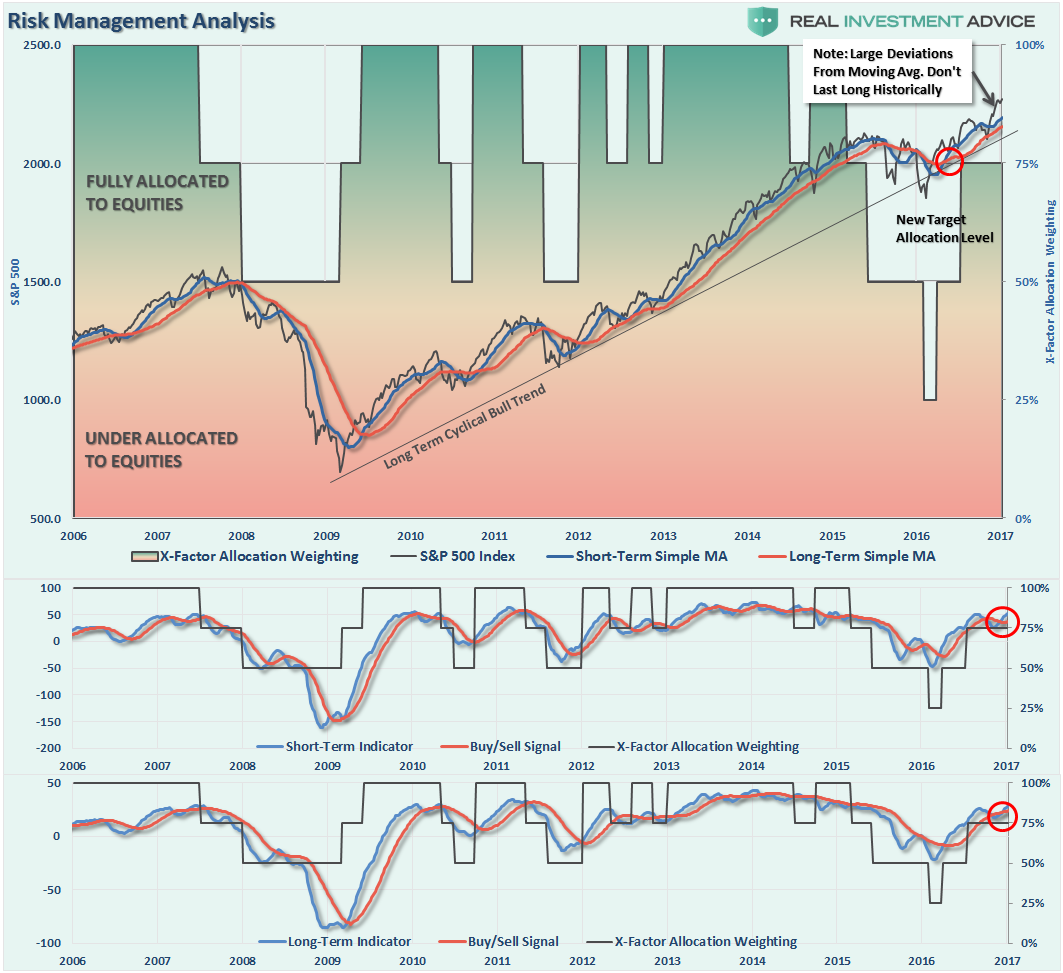
There are 4-steps to allocation changes based on 25% reduction increments. As noted in the chart above a 100% allocation level is equal to 60% stocks. I never advocate being 100% out of the market as it is far too difficult to reverse course when the market changes from a negative to a positive trend. Emotions keep us from taking the correct action.

Started With A Bang
With the last holiday-shortened trading week behind us, and traders coming back to work in force on Monday, look for some selling next week. (Managers can take in gains and not pay taxes until 2018)
The last three years have seen some pretty decent corrective actions in January. However, when you have three years in a row of anything, the odds rise this year could be different. However, we don’t want to necessarily “bet on that” with our retirement money.
With buy signals on all three indicators registered currently, any corrections are likely to be somewhat limited back to the rising short to intermediate-term moving average. This would suggest a correction back to 2200 would likely be a “buyable” trading level. As noted in the chart above, the current extension above the moving average will likely be corrected in fairly short order and we can use that correction to rebalance allocation models for the beginning of this year.
As noted in the main body of this week’s missive, there are many statistical indications that make the current year ahead a coin flip as to outcomes. After 8-years of a cyclical bull market, excessive risk taking in portfolios is having diminished rates of return particularly given the extraction of liquidity by the Fed.
Use this current extension in the market to continue rebalancing portfolios following the guidelines detailed in previously.
Step 1) Clean Up Your Portfolio
- Tighten up stop-loss levels to current support levels for each position.
- Hedge portfolios against major market declines.
- Take profits in positions that have been big winners
- Sell laggards and losers
- Raise cash and rebalance portfolios to target weightings.
Step 2) Compare Your Portfolio Allocation To The Model Allocation.
- Determine areas requiring new or increased exposure.
- Determine how many shares need to be purchased to fill allocation requirements.
- Determine cash requirements to make purchases.
- Re-examine portfolio to rebalance and raise sufficient cash for requirements.
- Determine entry price levels for each new position.
- Determine “stop loss” levels for each position.
- Determine “sell/profit taking” levels for each position.
(Note: the primary rule of investing that should NEVER be broken is: “Never invest money without knowing where you are going to sell if you are wrong, and if you are right.”)
Step 3) Have positions ready to execute accordingly given the proper market set up. In this case, we are looking for a correction to reduce the overbought condition of the market to allow for a better opportunity to rebalance equity risk.
If you need help after reading the alert; don’t hesitate to contact me.
Current 401-k Allocation Model
The 401k plan allocation plan below follows the K.I.S.S. principal. By keeping the allocation extremely simplified it allows for better control of the allocation and a closer tracking to the benchmark objective over time. (If you want to make it more complicated you can, however, statistics show that simply adding more funds does not increase performance to any great degree.)

401k Choice Matching List
The list below shows sample 401k plan funds for each major category. In reality, the majority of funds all track their indices fairly closely. Therefore, if you don’t see your exact fund listed, look for a fund that is similar in nature.

Disclosure: The information contained in this article should not be construed as financial or investment advice on any subject matter. Streettalk Advisors, LLC expressly disclaims all liability in ...
more

