Talk Of A Crash
There is some talk of a crash. We've gone from annoying lectures about how normal it is for the market to have significant corrections, to discussions about the signs to look for when the market is about to crash.
From a contrarian's point of view, I would say that such negative sentiment works in favor of stock prices. But, even knowing that isn't helping my mood.
I must admit I am worried about a crash, mostly because of the elevated levels of new 52-week lows. I will leave it at that because I am as unsure as the next person about this market.

There are no signs yet that a short-term uptrend is starting, but I am watching for the signs every morning. Even as I worry about a crash, I am going through my normal routine where I watch for the telltale signs of the market's internal cycles.

It's interesting that junk bonds really haven't fallen hard along with the market. It is a glimmer of hope for the general stock market. As a general rule, invest in the direction of junk bond prices.

Very bad news. The ECRI Index is starting to tick lower again, and it is now below the zero-level. This is the point where you sit up and notice that the economy is struggling.

Now we are looking for signs that will help tell us that the market has sold off enough and is ready for at least a counter-trend rally.
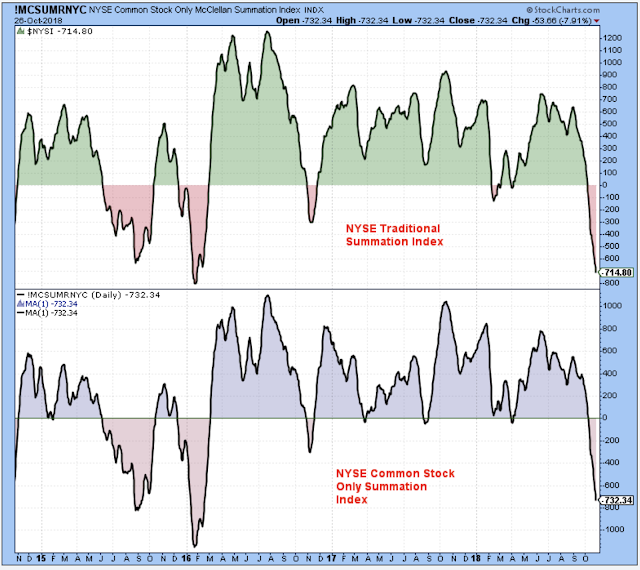
These Summation indicators are a good place to start, and they look like they are at levels where the market could firm up and bounce.

Martin Pring likes this index as an indicator that shows the health of the market leaders. I see weakness, but this was a steep climb that deserves consolidation. In other words, it isn't helping me.

The bond/stock ratio finally rallied this week meaning that the negative stock sentiment finally got serious this past week. This chart finally puts us one step closer to seeing a bottom for stock selling.

This longer-term trend needs to hold.

The weekly RSI (top panel) is near a level where you would expect it to bounce, and so is the stochastic (bottom panel). The dip in the price channel in the middle panel reveals that this is more than the average decline for this particular bull market.
If this chart were presented on the CMT exam, I would say that based on this chart alone, I expect a counter-trend rally, but that when the rally is finished there will be another low for stock prices.

Outlook Summary:
The long-term outlook is negative.
The medium-term trend is down as of Oct-4.
The short-term trend is down as of Sep-21.
The medium-term trend for bond prices is down as of Sep-7 (prices lower, yields higher).
Investing Themes:
Medical Products
Strategy:
- Buy large cap stocks and ETFs at the lows of the medium or short-term trends.
- Buy small cap growth stocks on breaks to new highs in the early stages of short-term up trends.
- Stop buying when the short-term trend is at the top of the range.
- Take partial profits when the uptrend starts to struggle at the highs.
- Never invest based on personal politics.
MON Sector Strength - TUE Rates - WED Medium-Term - THU Commodities Currencies - FRI Sentiment - SAT Longer-Term
Disclaimer: I am not a registered investment advisor. My comments above reflect my view of the market, and what I am doing with my accounts. The analysis is not a recommendation to buy, ...
more


