
One Weak Breakout
In last week’s missive, I discussed the confusion of the market:
“In the lead right now are sectors that are both “risk on” (ie Technology, Emerging Market and Discretionary) as well as the “risk off” sectors. (Utilities, Health Care and Staples).
Talk about confused.
The problem, of course, that both trades are unlikely to be right. Either the market is going to breakout to the upside with a clear participation in the ‘risk on’ stocks, or money will begin a rotation into the ‘risk off’ trade of bonds and defensive equities. “
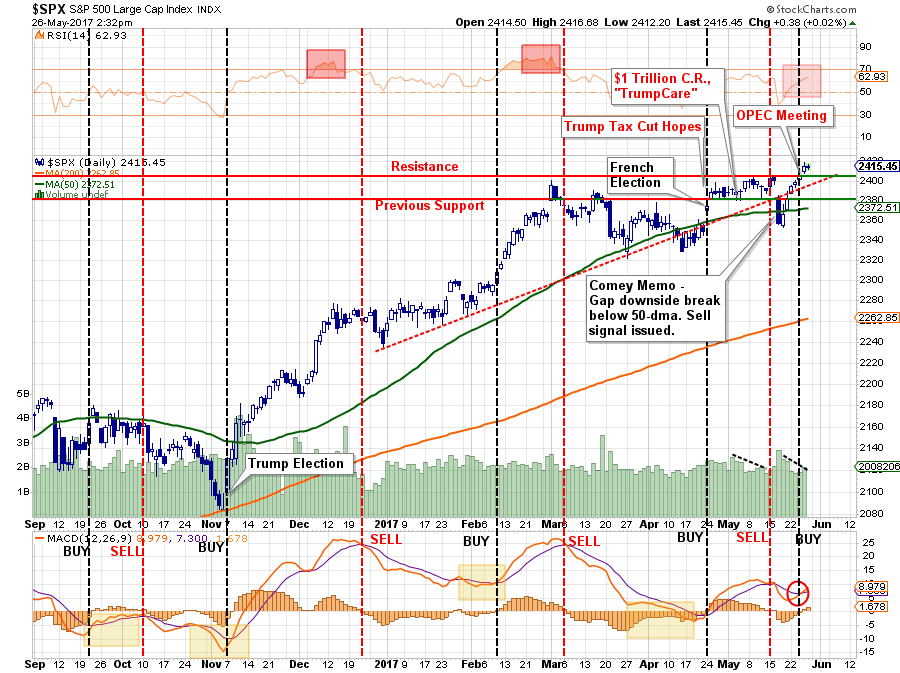
Well, the market did break out of the trading range that began back in March as noted below.
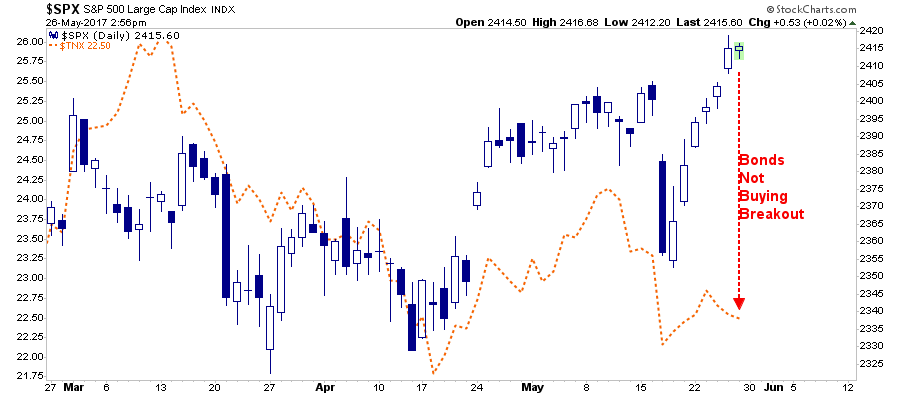
However, it did so without there being a rotation from the “risk off” trade back into equities, or, “risk on.”
The failure of the market to rotate to the “risk on” trade should not be lightly dismissed. A healthy breakout of the market should have been accompanied by both an increase in trading volume and leadership from the “smaller and riskier” stocks in the market. The chart below is the Russell 2000 Index as compared to the S&P 500 Index.
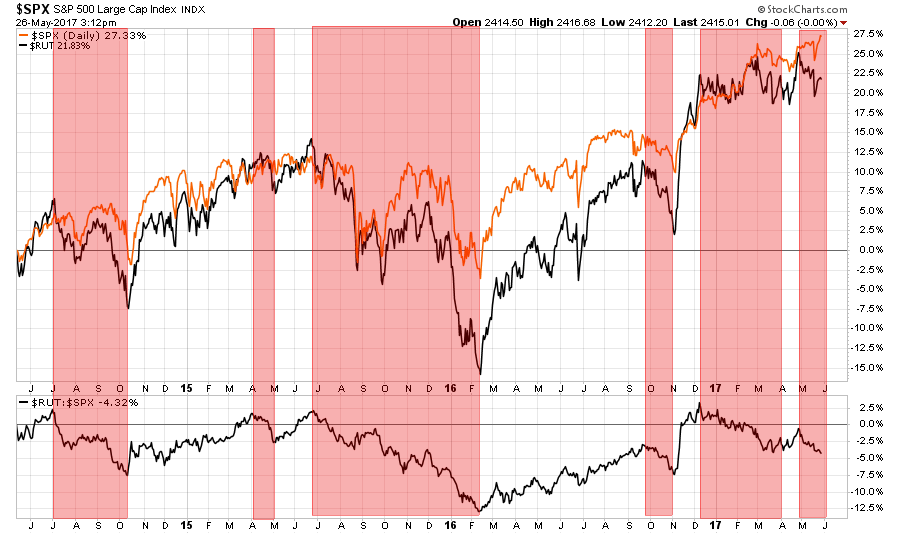
As shown by the red highlights, such divergences in the index tend not to last long and either a correction in the S&P 500 occurs OR the “risk trade” returns with a vengeance.
However, currently it is only the large cap stocks, and primarily the #FANMAG mega caps of Facebook, Amazon, Netflix, Microsoft, Apple, and Google, which have been propelling the major market to new highs while the Russell 2000 remains within its downtrend. Which has continued to create the divergence in internals discussed last Tuesday:
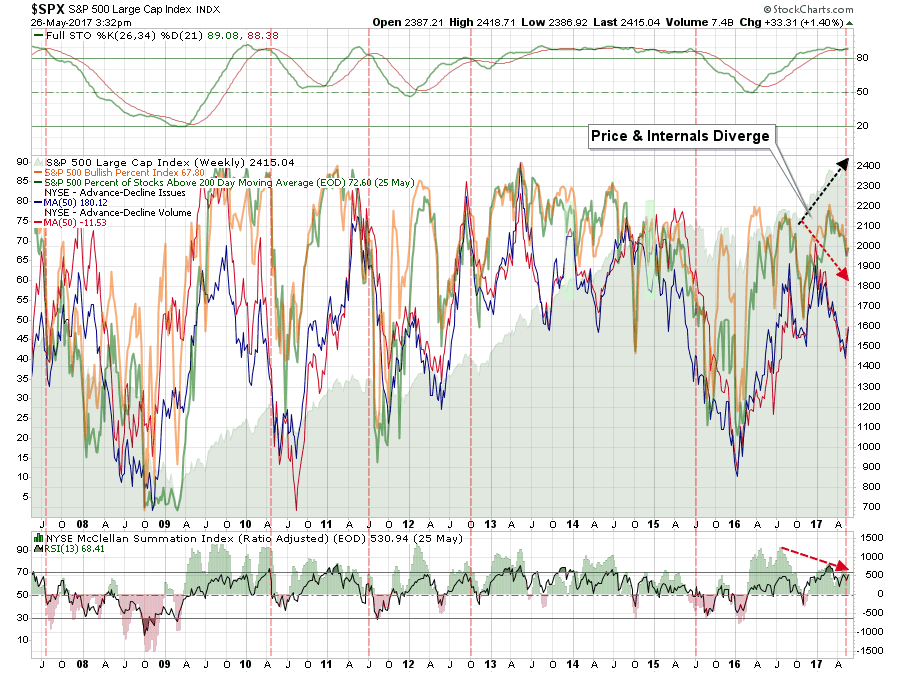
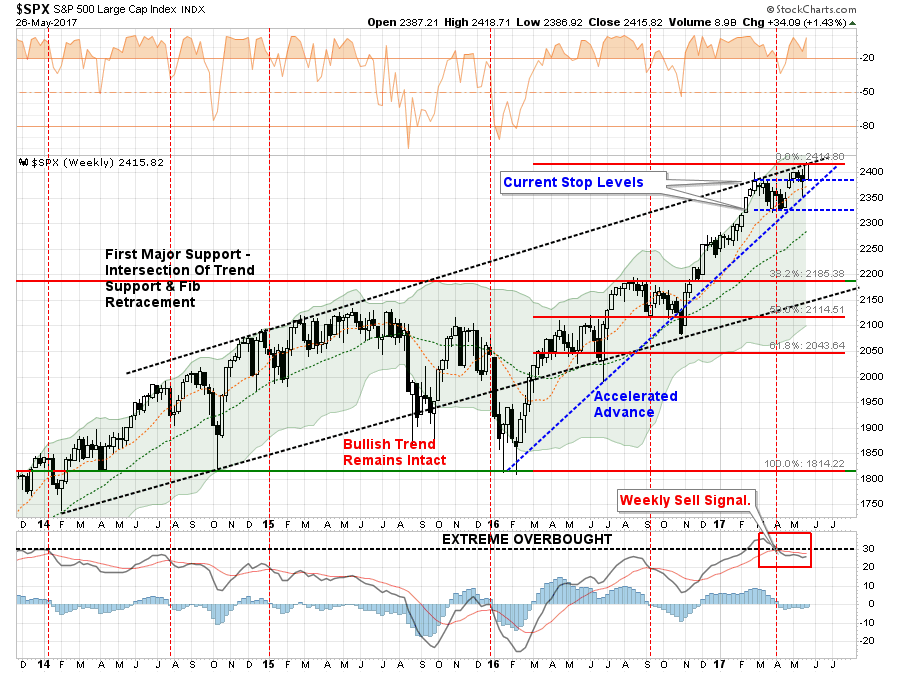
“The 10-year chart below, while a bit cluttered, shows several very important things worth considering currently. First, the top part of the weekly chart is essentially a buy/sell indicator. Each sell signal previously, has been indicative of a correction. The middle of the chart is a combination of internal strength indicators from the number of stocks on bullish buy signals, advancing vs declining issues and volume, and the percent of stocks above their 200-day moving average.”
While the markets did bullishly break out of the “consolidation” of the last couple of months, it did so rather weakly which keeps our guard up for now.
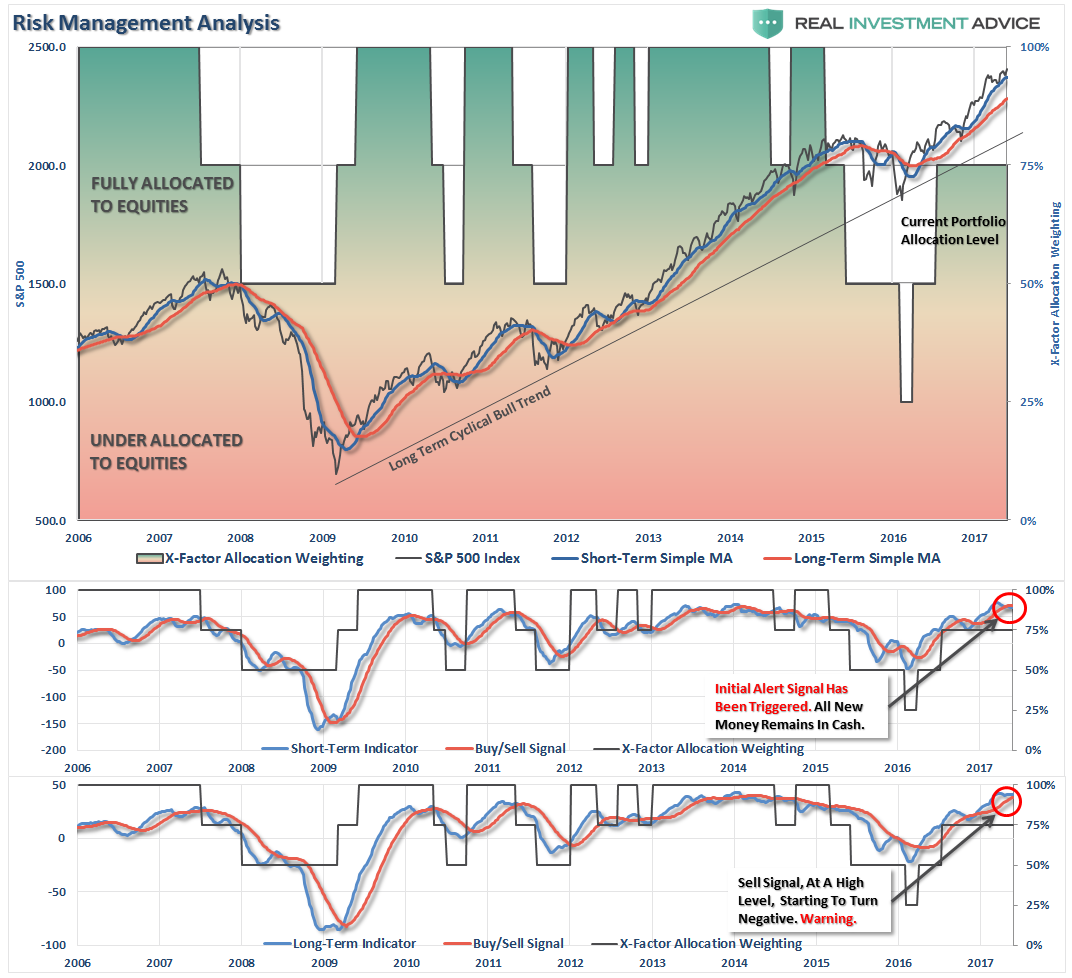
The breakout does keep our allocation model nearly fully allocated. We are holding onto a little larger than normal cash pile just to hedge some volatility risk during the summer months. Also, stops have now moved up to the bottom of the bullish trendline as shown in the chart below which coincides with the 100-day moving average which has been a running support line.
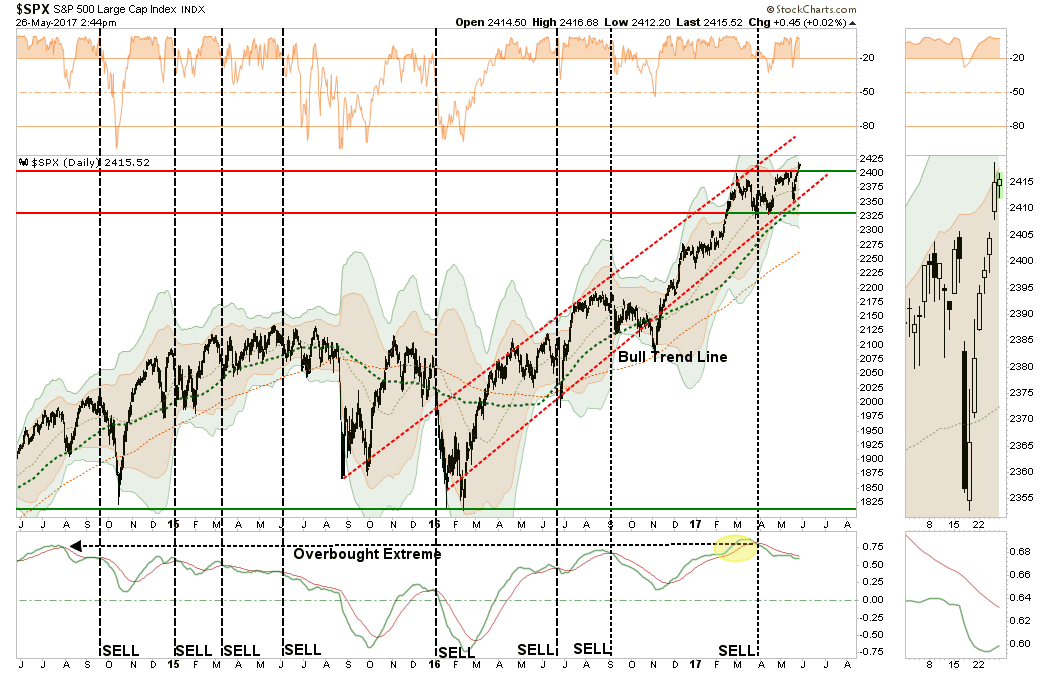
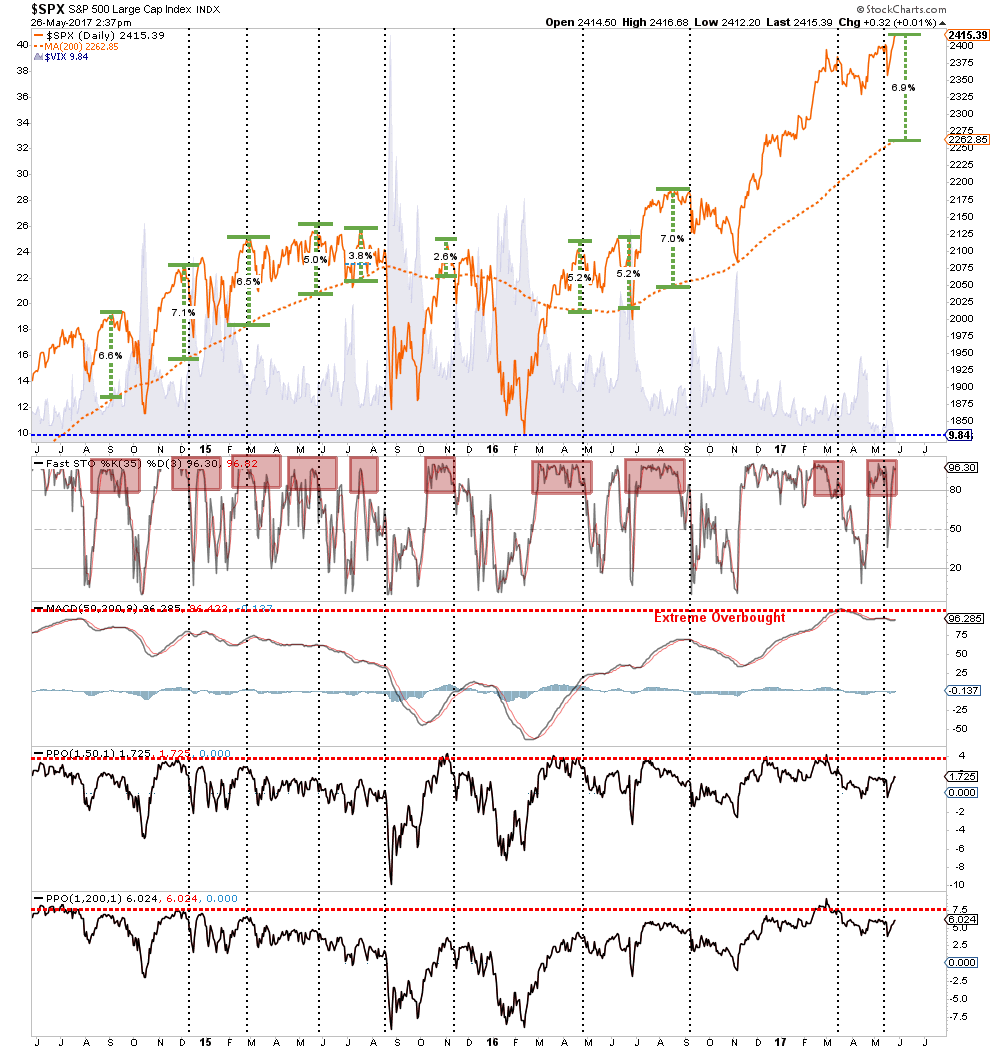
The “sell signal” currently in place from very high levels, and a full 2-standard deviation push from the 50-dma, also keeps us cautiously guarded for now.
Lastly, the deviation of the market from the 200-dma is also at levels that have previously not been conducive for a successive push higher in prices particularly with volatility at extremely low levels.
There is no denying the “bullish bias” currently remains in the market, and because of that “bias” we remain allocated towards risk.
However, it should be remembered this is exactly how “bull markets” are both formed and end.
“Bull markets rise, and in the end rise sharply, as the last marginal players are finally sucked in. It is only then, when there are too few buyers remaining to offset the rising tide of sellers, the inevitable unwinding occurs.”
Muni-Bond Market: “Trump’s Tax Cuts Are Dead”
Since the election, much of the reasoning behind the surge higher in asset prices has been the expected tax cut/reform from the Trump administration which, as the theory goes, would lead to a surge in economic growth, higher inflation, and subsequently higher bond yields.
Unfortunately, given the lack of progress on the ACA replacement/repeal, the harsh pushback and criticism of Trump’s proposed budget, and the ongoing investigations and inner turmoil of the Trump Administration, the likelihood of tax cuts is becoming a much more distant reality. As such, the municipal bond market (and the Treasury market) have begun to aggressively discount the probability of significant tax reform any time soon.

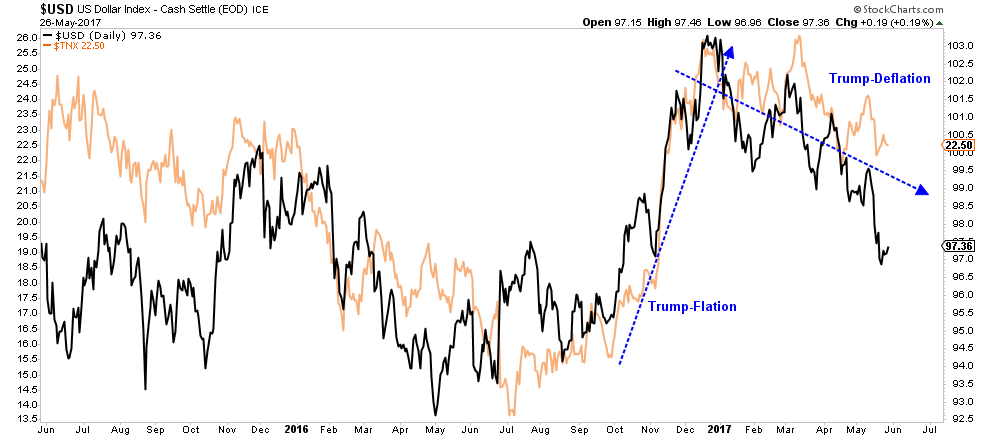
Furthermore, the whole “reflation” trade also seems to come down to a similar agreement about the possibility of the Trump Administration to achieve any of its policy goals. As shown below, the Dollar/Interest Rate trend is clearly negative.
As RBC macro strategist Mark Orsley wrote Friday:
“I am finding it increasingly difficult to see a near-term catalyst for UST’s to sell off. In fact, almost all indicators I watch are flashing a warning that a breakdown in yields (longer end) is increasingly probable.”
I have long been discussing that a move to 2% or below is quite likely (see here) but as Orsley points out:
“Technicals -> two head and shoulder formations point to lower yields. Target of 2.05% on the Feb/March formation, and if 2.17% gives way, the H&S from April/May targets 1.95%. Notice the MACD starting to trend lower…”
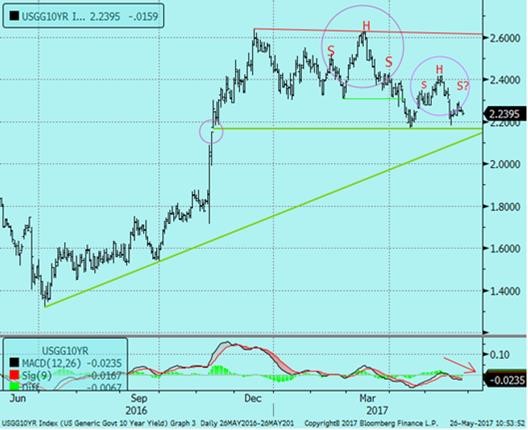
He is correct. A breakdown in yields will likely come with the realization that current earnings projections are far too optimistic to support current market valuations which will likely be coupled with concerns of a recessionary onset from further Fed rate hikes. Any rallies in rates back to 2.4% should likely be used to add additional exposure to bonds for a trade in the weeks ahead.
As Orsley concludes:
“It may seem like a no-brainer to short at these levels into a Fed hike (at least this time the market isn’t going in at the yield highs), but all the above indicators should serve as a warning to bond bears. Despite cleaner short positioning, the pain trade still remains lower yields.“
I agree.
The Big Risk
Baupost Group’s Seth Klarman recently laid out his concerns with the market is a recent client letter that was reviewed by Business Insider:
“Risk, Klarman wrote, is the most important consideration when investing, and investors are being too trusting.
When share prices are low, as they were in the fall of 2008 into early 2009, actual risk is usually quite muted while perception of risk is very high. By contrast, when securities prices are high, as they are today, the perception of risk is muted, but the risks to investors are quite elevated.”
The problem with overvaluation and investor exuberance is they are clear hallmarks of historical bull market peaks. This is particularly the case when there is a central asset, or asset class, that investors are piling headlong into without regard to the consequences. As I addressed recently:
“When it comes to investing, ALL investors, individual and professionals, are subject to making “stupid” decisions. As I discussed recently:
At each major market peak throughout history, there has always been something that became “the” subject of speculative investment. Rather it was railroads, real estate, emerging markets, technology stocks or tulip bulbs, the end result was always the same as the rush to get into those markets also led to the rush to get out. Today, the rush to buy “ETF’s” has clearly taken that mantle, as I discussed last week, and as shown in the chart below.”

As noted in the NYT, Seth is a little more realistic about the effect of “Trumptopian” policies on the markets and the economy. To wit:
“Exuberant investors have focused on the potential benefits of stimulative tax cuts, while mostly ignoring the risks from America-first protectionism and the erection of new trade barriers.
President Trump may be able to temporarily hold off the sweep of automation and globalization by cajoling companies to keep jobs at home, but bolstering inefficient and uncompetitive enterprises is likely to only temporarily stave off market forces. While they might be popular, the reason the U.S. long ago abandoned protectionist trade policies is because they not only don’t work, they actually leave society worse off.”
Markets have rallied since Trump was elected in November, as Wall Street took confidence in the president’s plan to cut taxes, roll back on regulations, and boost infrastructure spending. As I have penned in this missive many times, the RISK TO INVESTORS is what happens if those expectations either DO NOT materialize OR fall well short of expectations.
The risk of disappointment is exceptionally high.
While we currently remain long-biased in portfolios, we do so with stops and hedges in place, risk management controls active, and a focus on capital preservation.
While you may not agree with our positioning, we have managed money through these exact cycles in the past and survived.
That is why we remain a slave to our discipline and our rules.
Take a moment to remember those individuals who made the ultimate sacrifice so that we, as a nation, can remain free, pursue happiness, enjoy liberty and thrive in the greatest nation on earth.
.
Market & Sector Analysis
Data Analysis Of The Market & Sectors For Traders
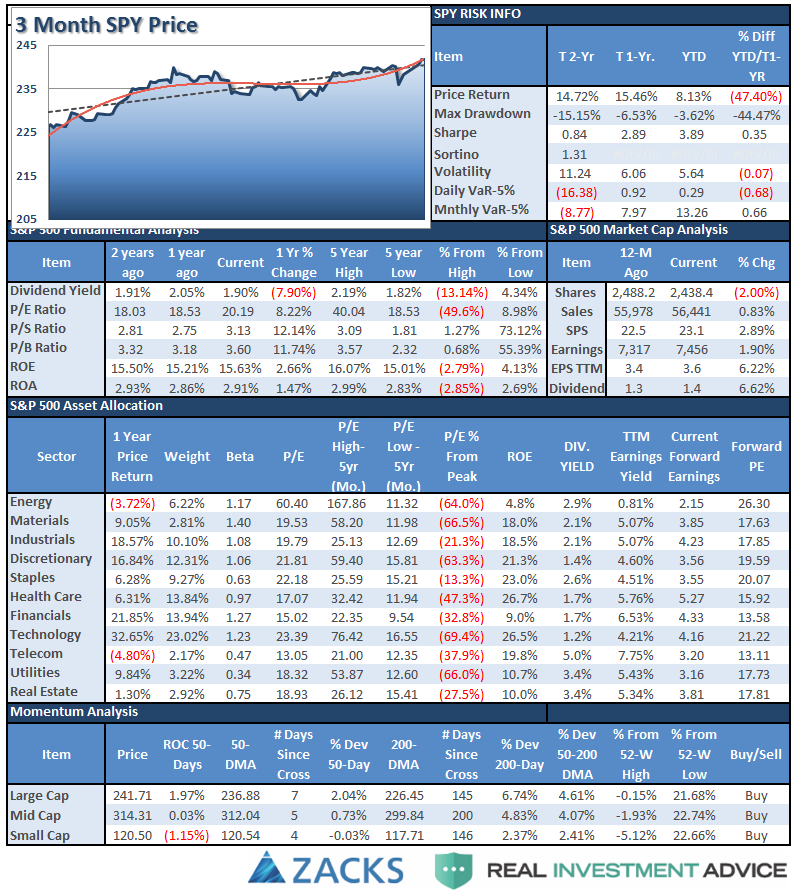
S&P 500 Tear Sheet
The “Tear Sheet” below is a “reference sheet” provide some historical context to markets, sectors, etc. and looking for deviations from historical extremes.
If you have any suggestions or additions you would like to see, send me an email.
Performance Analysis
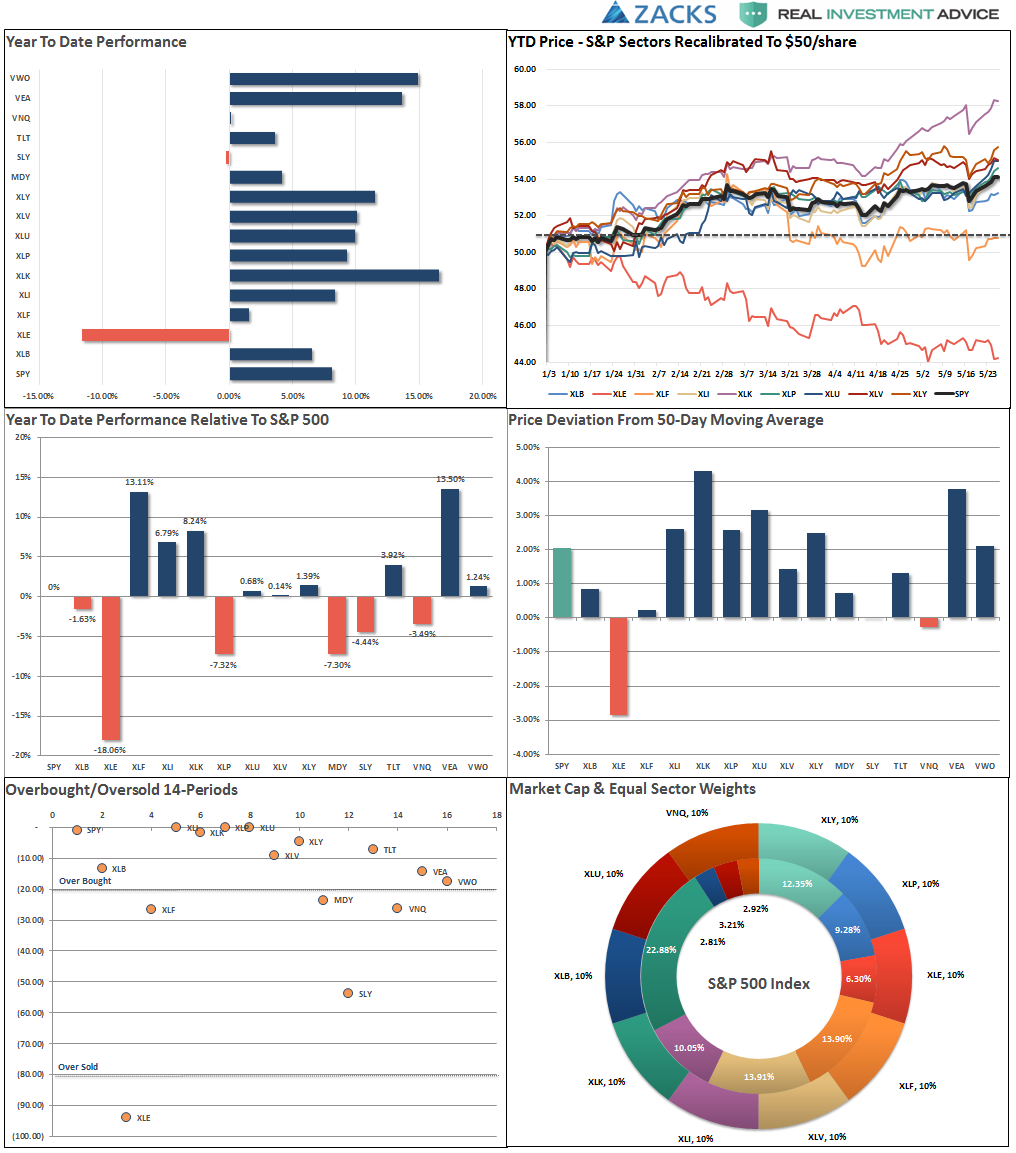
Do you find this chart useful? If you have any suggestions or additions you would like to see, send me an email.
Sector Analysis
With the markets breaking out of the two-month consolidation and hitting new highs this past week, as stated above, it keeps our portfolios allocated on the long side for now.
On Thursday and Friday, we did add modestly to our broader-based “core” holdings to participate with the breakout. However, as shown below, stops have been moved up and remain very tight. A reversal and failure of the breakout would NOT be surprising given the underlying weakness in the internal breadth and participation measures.
Importantly, notice that despite the “breakout to new highs,” it did NOT reverse the weekly “sell” signal due to the “volumeless” lift. This keeps us cautious at the moment until that signal reverses.
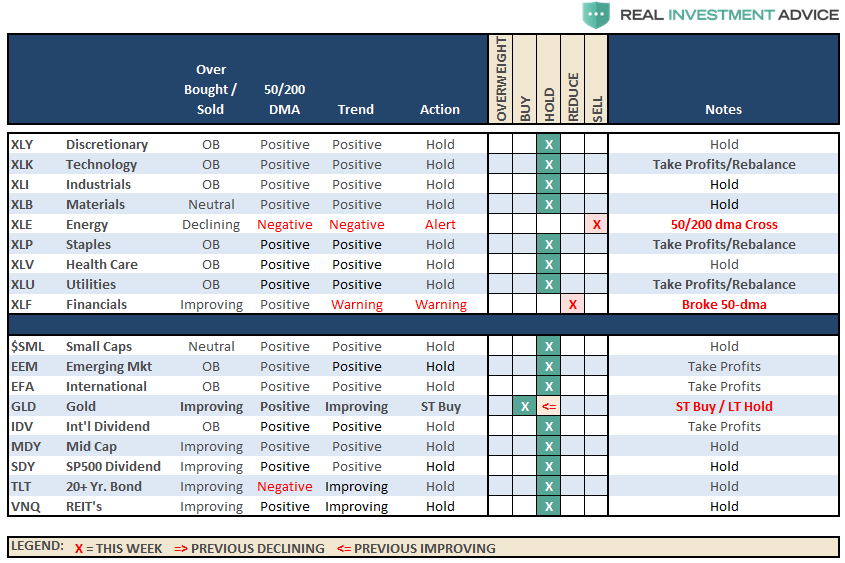
Sector Review

As discussed last week, this continues to be ONE CONFUSED MARKET as, once again, both DEFENSIVE and OFFENSIVE sectors rallied.
Discretionary, Technology, Staples, Utilities, Health Care, and Industrials all rose last week. However, it was the sharp surge in Staples and Utilities that stood out last week as traditionally defensive sectors took charge in a “bullish breakout.”
Materials and Financials remained exceptionally weak and keeps us cautious on these sectors at the current time.
Energy – Despite the OPEC meeting extending production cuts and the rally in oil prices, the sector remains in a negative downtrend. With a major sector sell signal, and the cross of the 50-dma below the 200-dma, we remain out of the space for the time being.
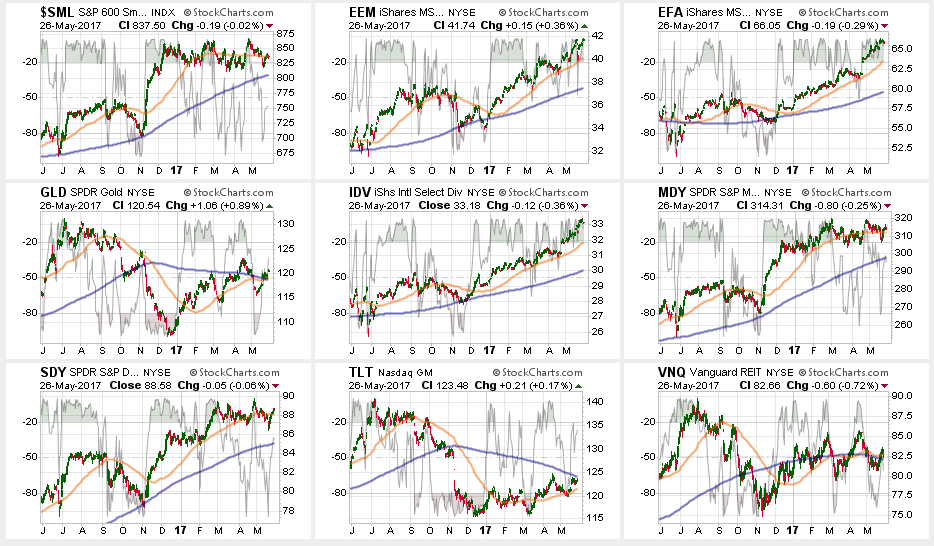
Small and Mid-Cap stocks both broke their respective 50-dma’s which puts these areas in portfolios at risk for now. The underperformance of these markets relative to S&P 500 suggests a narrowing of the market. Given the lack of “risk on” action following the breakout last week, we remain cautious for now.
Emerging Markets and International Stocks continued their strength since their election lows as money continues to chase performance. There is a good bit of risk built into international stocks currently. We took profits a few weeks ago, but the recent extension suggests another round of rebalancing is likely wise. Take profits and rebalance sector weights but continue to hold these sectors but stop levels should be moved up to the 50-dma.
Gold – The rally in Gold last week once again puts a potential trading opportunity in place on a “short-term”basis. For longer-term investors, like us, we still need a breakout of the long-term downtrend at $1300/oz to take on portfolio weightings. With the 50-dma now above the 200-dma, a position can be added with a stop at the 200-dma.
S&P Dividend Stocks regained key support levels currently after briefly breaking below their 50-dma. Hold current positions but maintain stops at the lows from last week.
Bonds and REIT’s had gotten oversold last week and found some support this week with the surge in the“risk off” trade as discussed above. Both sectors are trending positively but are struggling with major overhead resistance. A breakout of these two sectors will likely coincide with weakness in the broader market, so watch these sectors for clues as to what happens next.
The table below shows thoughts on specific actions related to the current market environment.
(These are not recommendations or solicitations to take any action. This is for informational purposes only related to market extremes and contrarian positioning within portfolios. Use at your own risk and peril.)
Portfolio Update:
The bullish trend remains positive, which keeps us allocated on the long side of the market for now, but the weekly “sell signal” alert is not being dismissed.
As noted last week:
“We are currently evaluating short-term market action to see if there is an opportunity to allocate some of our retained cash into underweight equity positions currently as part of the rebalancing process.”
With the breakout, we did increase our exposures a little bit, but I would like to see some continued strength into next week for confirmation before adding additional risk.b This is particularly the case as we move into the seasonally weaker months of the year. We are maintaining stops at recent support levels on all sectors and at 2325 on the S&P 500.
THE REAL 401k PLAN MANAGER
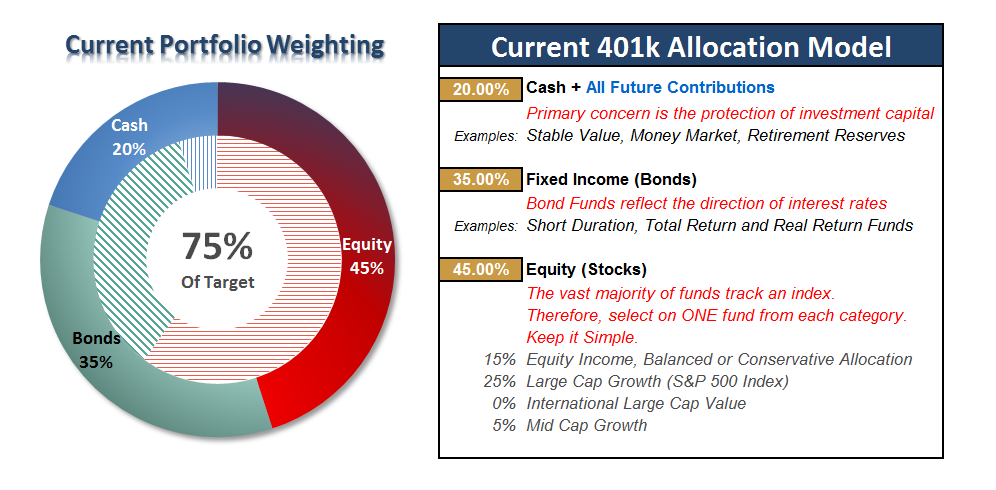
The Real 401k Plan Manager – A Conservative Strategy For Long-Term Investors
There are 4-steps to allocation changes based on 25% reduction increments. As noted in the chart above a 100% allocation level is equal to 60% stocks. I never advocate being 100% out of the market as it is far too difficult to reverse course when the market changes from a negative to a positive trend. Emotions keep us from taking the correct action.

Market Breaks Out
A bit of recent history so you will understand my thoughts on current positioning.
Two week’s ago, I raised the issue of a “breakout” reversing the weakness in the market from March. However, as was my concern then, the “breakout” was very short-lived and the markets took a hit the next week following concerns of more stalling of the legislative actions process.
Then last week, the markets recovered on Thursday and Friday and put the markets back on more secure footing, BUT was not enough to reverse the short-term “sell signal alert” as of yet which keeps the allocation model on hold this week.
Given the recent volatility of the market, the lack of any movement towards legislative action, and weak internal participation, we are maintaining cash levels and rebalancing portfolio allocations currently.
We will watch developments closely as we head into a shortened post-holiday trading week, and would like to see a firming of the market environment with a confirmation of this week’s breakout to increase the allocation model.
If things improve next week, we will upgrade the allocation model with an expectation of a 90-day holding period outlook. (This is due to stay in alignment with 401k trading restrictions. If we cannot get comfortable with a 90-day outlook, we will remain on hold.)
Refrain from adding further fixed income holdings, for now, take some profits from overweight holdings, but maintain exposures.
If you need help after reading the alert; don’t hesitate to contact me.
Current 401-k Allocation Model
The 401k plan allocation plan below follows the K.I.S.S. principal. By keeping the allocation extremely simplified it allows for better control of the allocation and a closer tracking to the benchmark objective over time. (If you want to make it more complicated you can, however, statistics show that simply adding more funds does not increase performance to any great degree.)
401k Choice Matching List
The list below shows sample 401k plan funds for each major category. In reality, the majority of funds all track their indices fairly closely. Therefore, if you don’t see your exact fund listed, look for a fund that is similar in nature.

Disclosure: The information contained in this article should not be construed as financial or investment advice on any subject matter. Streettalk Advisors, LLC expressly disclaims all liability in ...
more

