
Markets Hit All-Time Highs – Market Review 01-27-17
- Market Review – Risk/Reward
- Buy The Dip? Probably.
- Another Reason Not To Sell Bonds…Yet
- Sector By Sector Review
- Market & Sector Analysis
- 401k Plan Manager
Market Review – Risk/Reward
Since the November election of Donald Trump, the investing landscape has gone through a dramatic change of expectations with respect to economic growth, market valuations and particularly inflation. As I noted two weeks ago, there is currently “extreme positioning” in many areas which have historically suggested unhappy endings in the markets. To wit:
“Much like a ‘rubber band,’ prices can only be stretched so far before having to be relaxed to provide the ability to be stretched again.
The chart below shows the long-term trend in prices has compared to its underlying growth trend. The vertical dashed lines show the points where extreme overbought, extended conditions combined with extreme deviations in prices led to a mean-reverting event.”
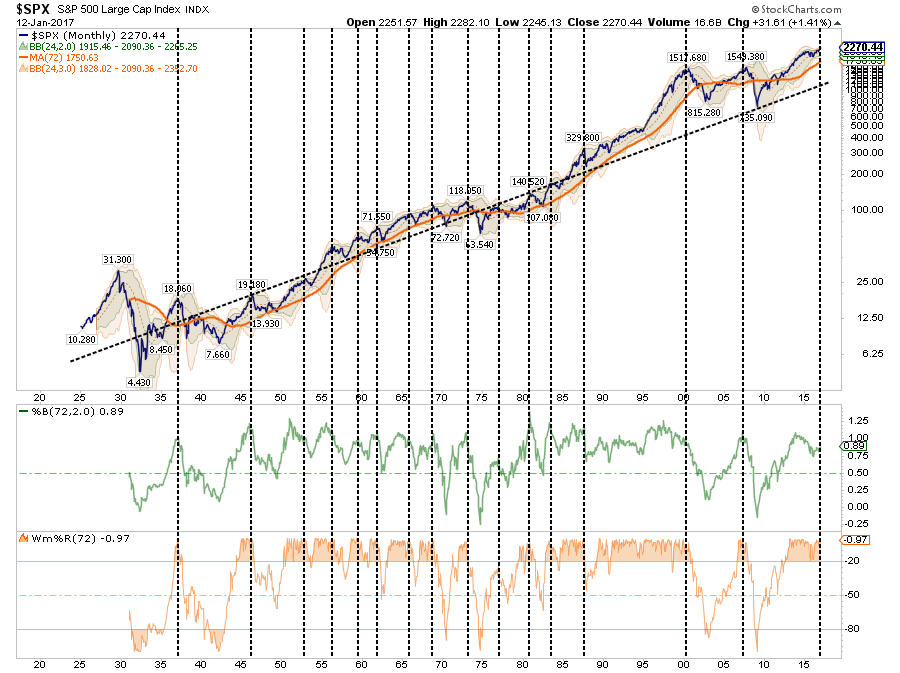
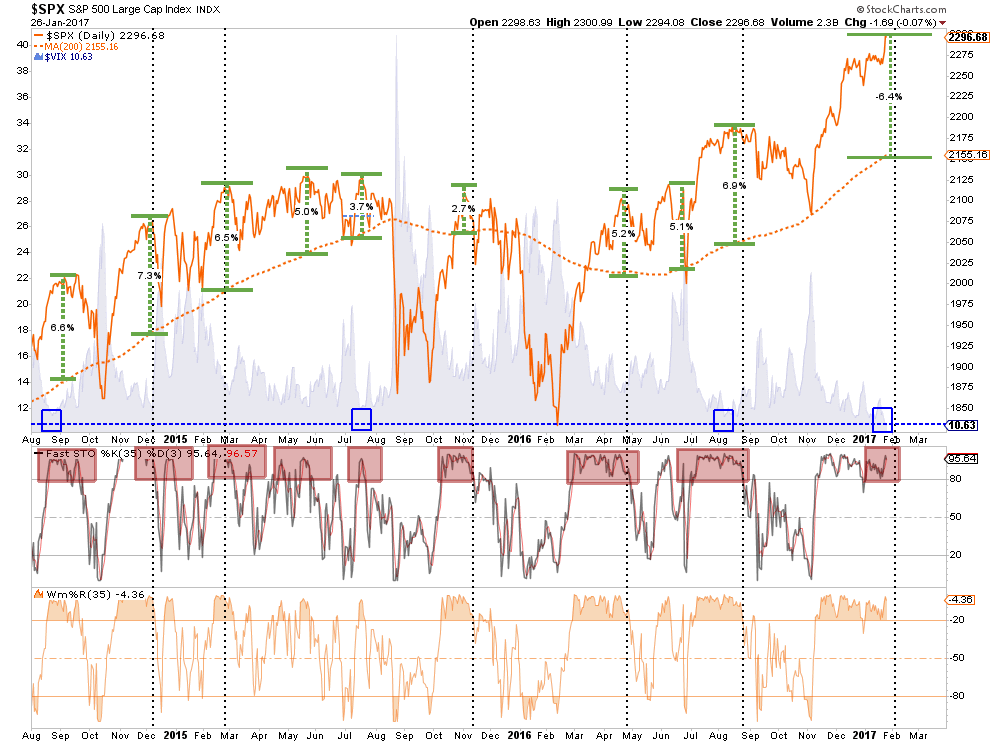
We can also witness the rather extreme extension of prices above the 200-dma. Such extensions, which are always combined with extreme overbought conditions, have typically not lasted long and have been a good indication to take profits in the short-term. This provides some opportunity to invest capital following a correction to some level of support.
Buy The Dip? Probably
HedgEye had a good note on why the market keeps going up against what we would deem to be rational behavior:
“How does the rate of change of volatility (VIX) affect what’s getting “expensive” and “cheap”?
I think about that in terms of the volatility of volatility. It’s something you can readily measure and map with futures and options data.
Looking at the S&P 500’s (SPY) realized volatility, for example:
- 30-day realized volatility has been smashed to 6.6%
- But, at 8.7%, implied volatility is trading at +29.2% premium
- On a TTM z-score that implied volatility premium is +0.44x”

“So that keeps telling me that the highest probability outcome remains for lower-highs and lower-lows in VIX.
And that keeps happening in a US Equity market that is often called “expensive” (it is), but doesn’t get cheaper. Maybe someone from the orthodoxy of macro “valuation” experts can chime in on why this is happening.
I think it’s because consensus continues to position for a correction that would be deemed “rational”, as opposed to buying all dips in an irrationally profitable position that’s been complimented by prevailing growth and inflation conditions.
Can the U.S. stock market get more expensive? Absolutely.”
A “buyable correction” would suggest a correction back to recent support levels that keep the overall “bullish trend” intact.
The chart below shows the recent advance of the market has gotten to extremely overbought conditions on a short-term basis and the ‘sell signal’ noted at the top of the chart, combined with the extreme overbought condition at the bottom, suggest a potential correction could take the market back to 2200. Also, note the negative divergence of the PMO oscillator despite the advance in the market.
While such a correction would be relatively minor in the short-term, it would also violate the bullish uptrend that has held since the 2016 lows.
However, putting this into an actual loss perspective, the following chart details specific support levels back to the psychological level of 2000. A violation of the 2000 level and we are going to start discussing the potential for a more severe market correction.
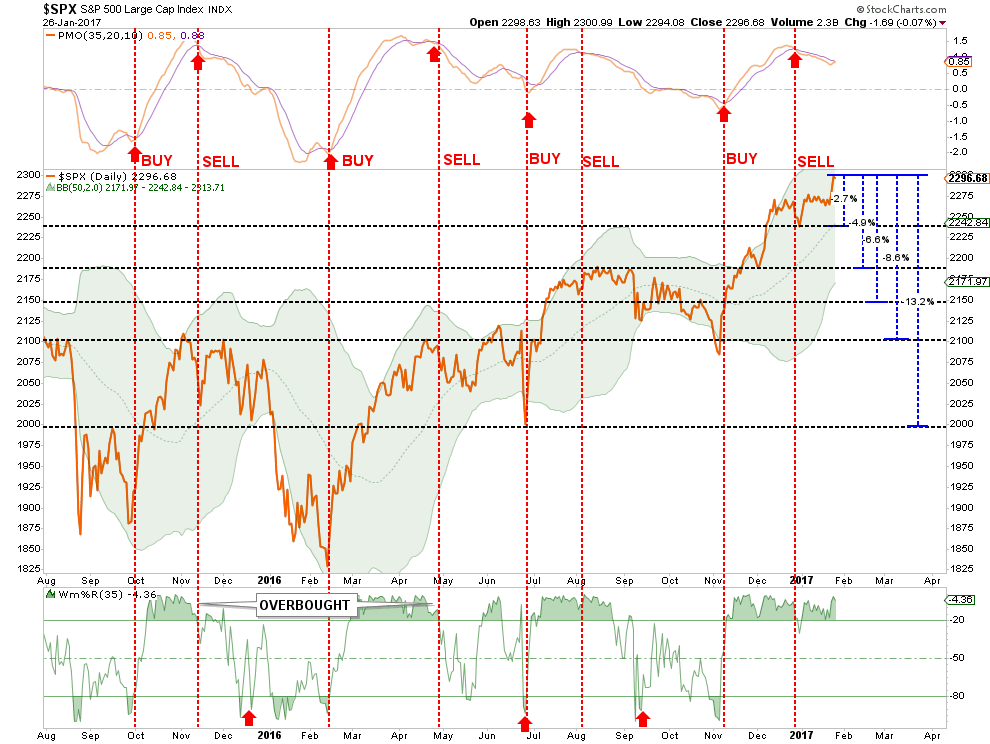
A violation of initial support level sets up corrections of 4.9%, 6.6%, 8.6% and 13.2% from the recent highs. With bullishness running at highs, and cash allocations at lows, the risk of a short-term reversal is high.
However, I am certainly not discounting the short-term ability for the markets to move higher as discussed in “2400 or Bust!.” This is particularly the case if fiscal policy is actually implemented, earnings improve more than expected or additional monetary policy is introduced. But it is the risk of loss that currently outweighs the reward.
However, there is another more extreme view that was put out by Matrix Trade yesterday:
“For the last seven years, we have tracked both the DJIA and SPX with very similar bull markets in both 1929 and its copy 1987 {made famous by Paul Tudor Jones using very similar technology for arguably one of the greatest trades of all time}. The US markets have now entered the last but most aggressive phase of the uptrend where sentiment takes over and where perma-bears give up all hope. They are now finally right in principle but not timing nor extent”

“We had wondered what would trigger such aggressive strength and volatility… until November 9th, 2016 when Donald Trump was elected. The subsequent change in the market dynamic not only provides the reasons for this move but also provides a very clear date from which to countdown very similar blowouts. As we have target areas for both percentage and a timeline to count up or down and indeed different indices to compare we will continue to monitor the price action exactly in line with these famous historic blowouts and crashes. Good Luck !”
Like a dealer at a poker table enticing players into a game:
“Step right up, place your bets and take your chances.”
Another Reason Not To Sell Bonds…Yet
As I penned last weekend:
“If the market corrects, OR the economy hits a speed bump, OR something happens in the Eurozone,OR…OR…OR…the covering of short positions in bonds will cause an extremely fast drop in yields.
Sure, anything can happen. If yields on the 10-year Treasury break above 3% it will be coincident with a sharp rise in consumer spending, wages, inflationary pressures that are broad based and surging economic growth. In such a case it will make sense to reduce bond holdings in favor of equities.
However, given the fact we are already in the 3rd longest economic expansion in history, combined with the second highest levels of valuation on stocks, the odds of such an outcome are extremely low.”
But here is another reason to stay long bonds.
Currently, as noted by ZeroHedge on Friday:
“With political and economic policy uncertainty at record highs and equity market valuations near record highs, we have one question: which market – interest rates or stocks – is right about ‘risk’ ahead?”
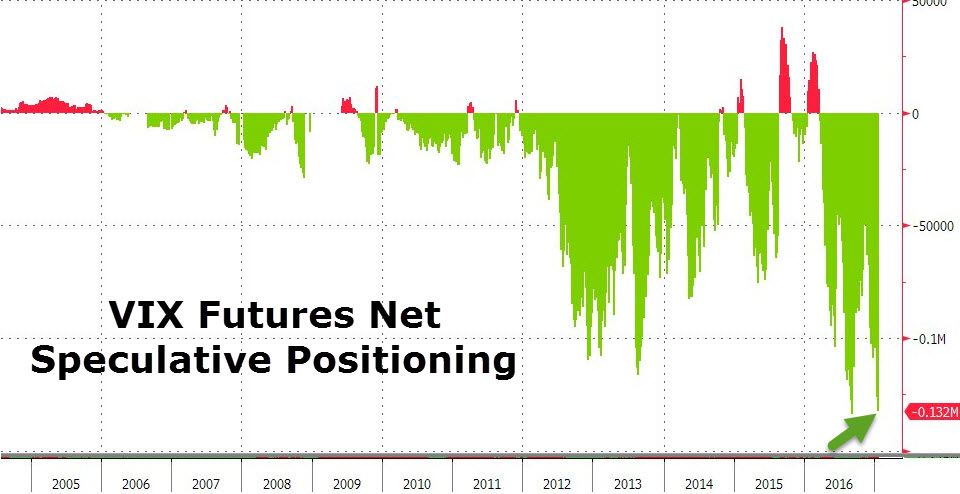
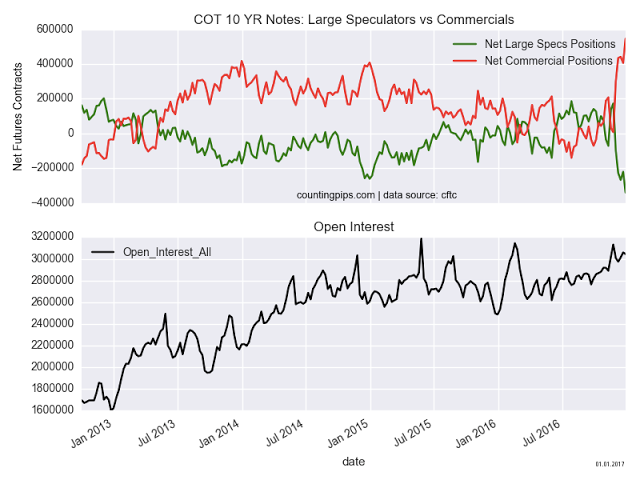
Currently, there are record shorts on volatility which suggest there is little expectation of a market correction currently. In other words, everyone is now on the long-side of the proverbial “boat.”
So, why own bonds?
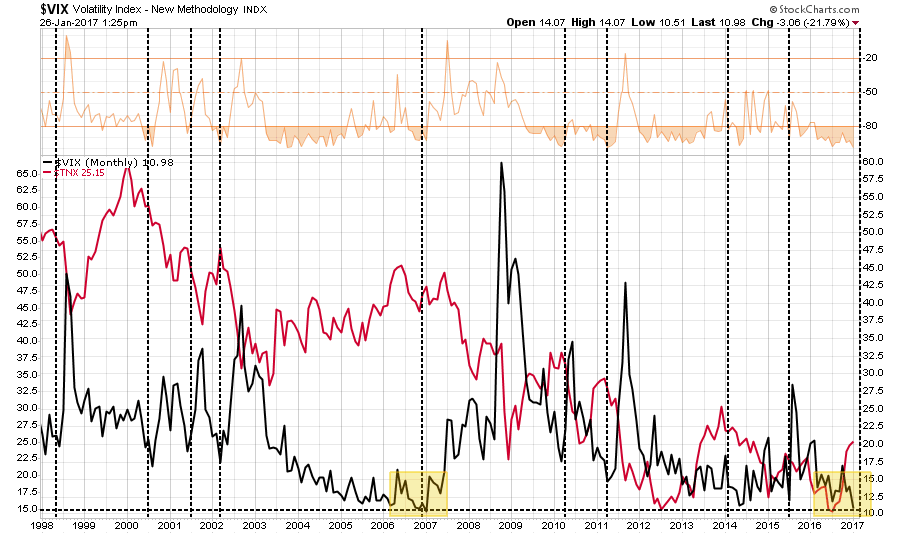
As shown in the chart below, interest rates are negatively correlated to the volatility index. With the extreme net short positioning in bonds, a market correction would spark a rotation from “risk” to “safety” pushing rates towards 2%. However, such a reversal would also trigger a panic-driven short-covering trade which would likely push rates even lower towards 1.5%.
That thought was also discussed recently at the Macro Man blog:
“We still think that Mr. Bond will have a soft landing this time. In fact, now that the Inaugural is behind us, with all of its ‘Sound and Fury signifying nothing’, Mr. Market will likely undertake a more cerebral evaluation of the likelihood of 4, 5 and 6% US GDP in 2017.
A renewed safe haven bid for Mr. Bond and other fixed income assets seems certain before long, as Real Money and commercials have increased their net longs. The speculative community remains extremely short bonds, providing a mechanism to accelerate any recovery in fixed income once it gathers speed, eventually forcing a surprising number of concealed shorts to return to a more neutral positioning in Treasuries.”
Currently, we remain long bonds as a hedge until the abnormalities are reversed.
Sector By Sector
Let’s take a quick look at the 9-major sectors of the S&P 500 to determine the overall strength of the bullish bias.
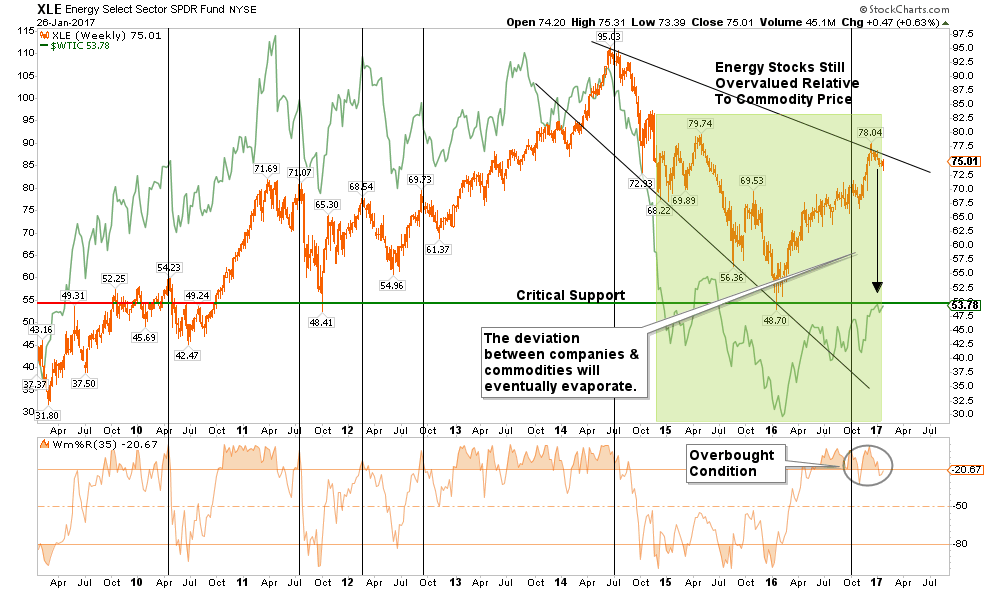
ENERGY
The OPEC oil cut will likely fail in the next two months particularly as the ramp up in protection continues in the Permian Basin. The Saudi’s are only going to give up so much “market share” before returning back to full production.
Like the extreme “short positioning” on the VIX and Treasuries, speculators are extremely net long in oil contracts. There is an extremely high probability the supply increase that is currently happening will not only cap oil price temporarily but will likely push oil prices lower in the months ahead.
Energy companies remain extremely overvalued and disconnected relative to the underlying commodity price. When the next economic recession hits, energy-related equities will likely once again recouple with its base commodity.
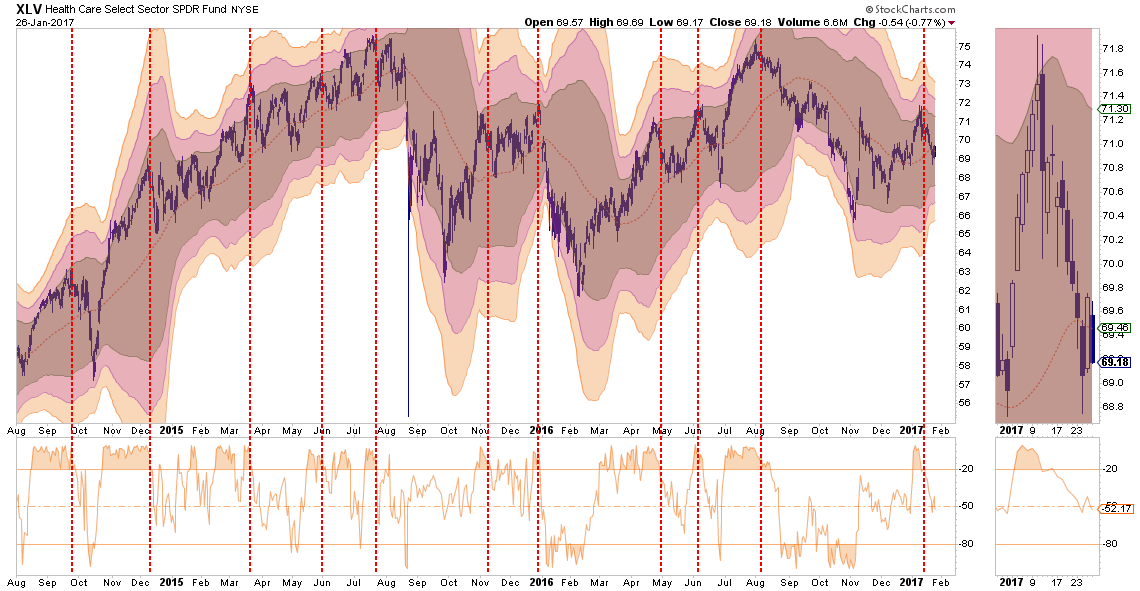
HEALTH CARE
The healthcare sector has been a laggard as of late and continues to struggle with the unknown of what is going to happen with the health care system overhaul under President Trump. With the sector very currently correcting from an overbought condition, there is not a reasonable risk/reward setup currently in the sector.
Current holdings should be reduced to under-weight for now as there is not a good stop-loss setup currently available.
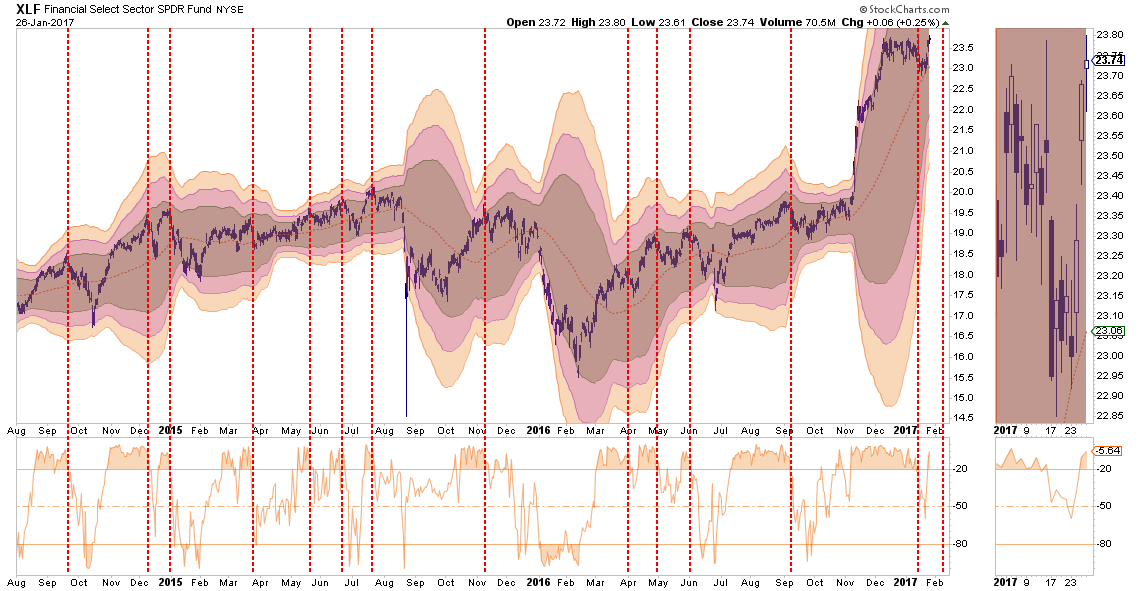
FINANCIALS
Financials continue to be the leader with respect to overall relative performance. There is a tremendous amount of exuberance being built into Financials which makes this sector ideal for reducing back to portfolio-weight, taking profits and setting a stop-loss at $22.50.
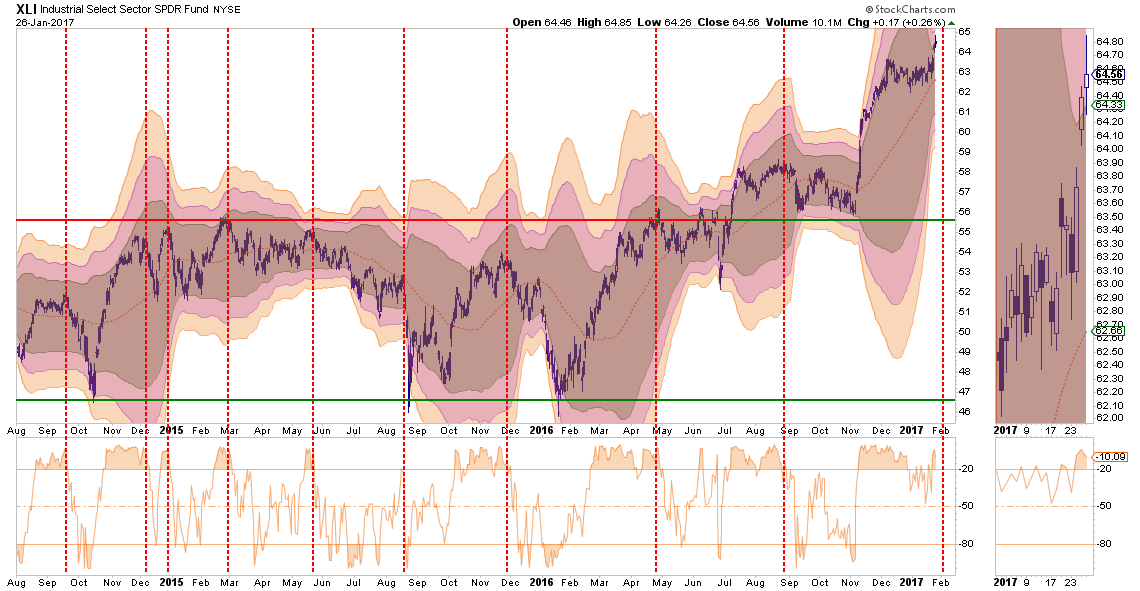
INDUSTRIALS
Industrial stocks, because of the dividend yield, have been a big beneficiary of the “yield chase” previously. Now, like Materials, they are the subject of the “Make America Great Again” infrastructure trade. However, this sector is directly affected by the broader economic cycle which continues to remain weak.
While the sector broke out to new highs, there is not a good risk/reward setup as there is a long way to a good stop level at $50. I would reduce holdings back to portfolio weight for now and take in some of the gains.
MATERIALS
As with Industrials, the same message holds for Basic Materials, which are also a beneficiary of the dividend / “Make America Great Again” chase. This sector should also be reduced back to portfolio weight for now with stops set at the lower support lines $49.50.

UTILITIES
Utilities have been picking up performance over the last couple of weeks as money begins to rotate back into “safety” plays of bonds and interest rate sensitive sectors. Stops should be set on current holdings at the lower support levels $47.50 for now and a break above resistance should set the sector up for a further advance.

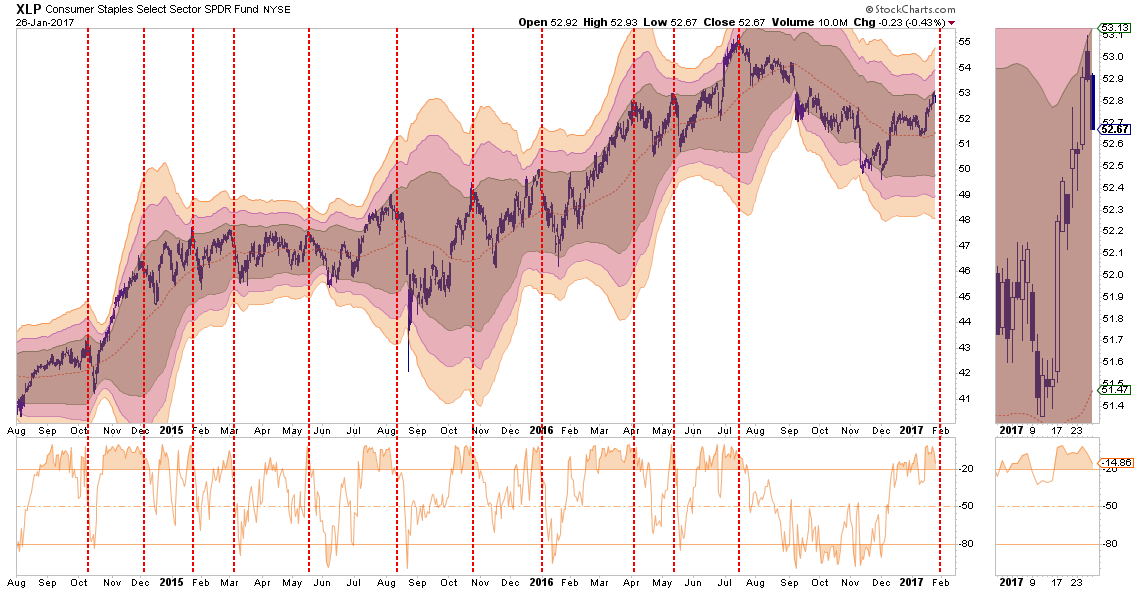
STAPLES
Staples, have recovered as of late and are now back to extreme overbought, along with every other sector of the market. Set stops at $52 for now and look for a correction that does not break support to increase exposure to the sector.
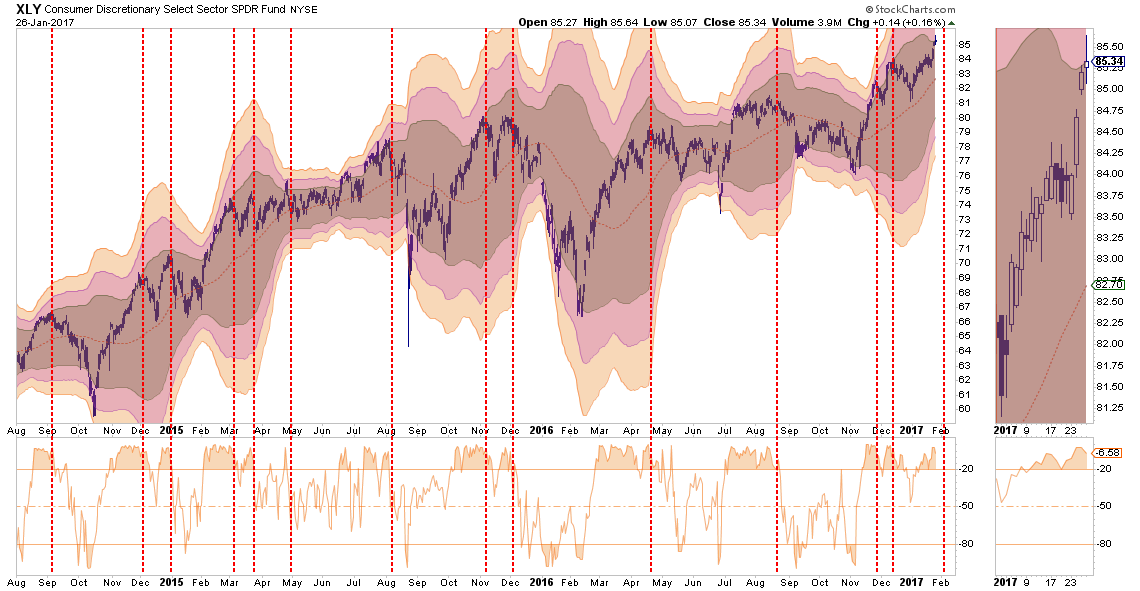
DISCRETIONARY
Discretionary has been running up in hopes the pick-up in consumer confidence will translate into more sales. There is little evidence of that occurring. Portfolio weightings should be trimmed back to underweight at the current time with stops set at $81. With many signs the consumer is weakening, caution is advised and stops should be closely monitored and honored.
TECHNOLOGY
The Technology sector has been the “obfuscatory” sector over the past couple of months. Due to the large weightings of Apple, Google, Facebook, and Amazon, the sector kept the S&P index from turning in a worse performance than should have been expected prior to the election and are now elevating it post election.
The so-called FANG stocks (FB, AMZN, NFLX, GOOG) continue to push higher, and due to their large weightings in the index, push the index up as well.
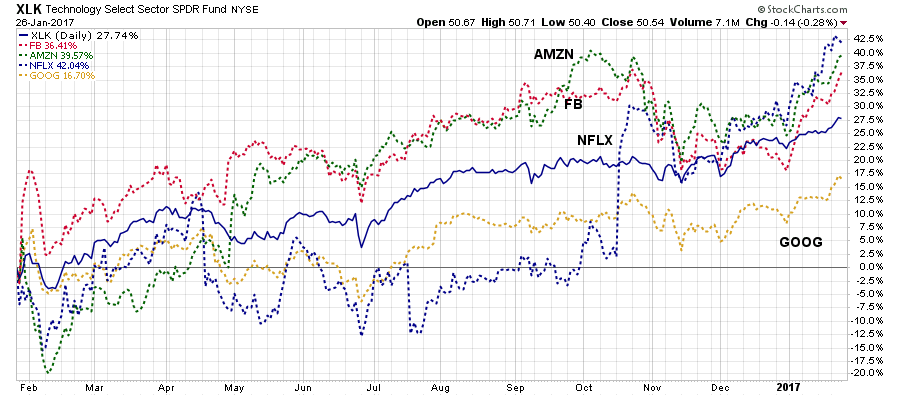
The sector is extremely overbought and stops should be moved up to $48 where the bullish trend line currently resides. Weighting should be revised back to portfolio weight.

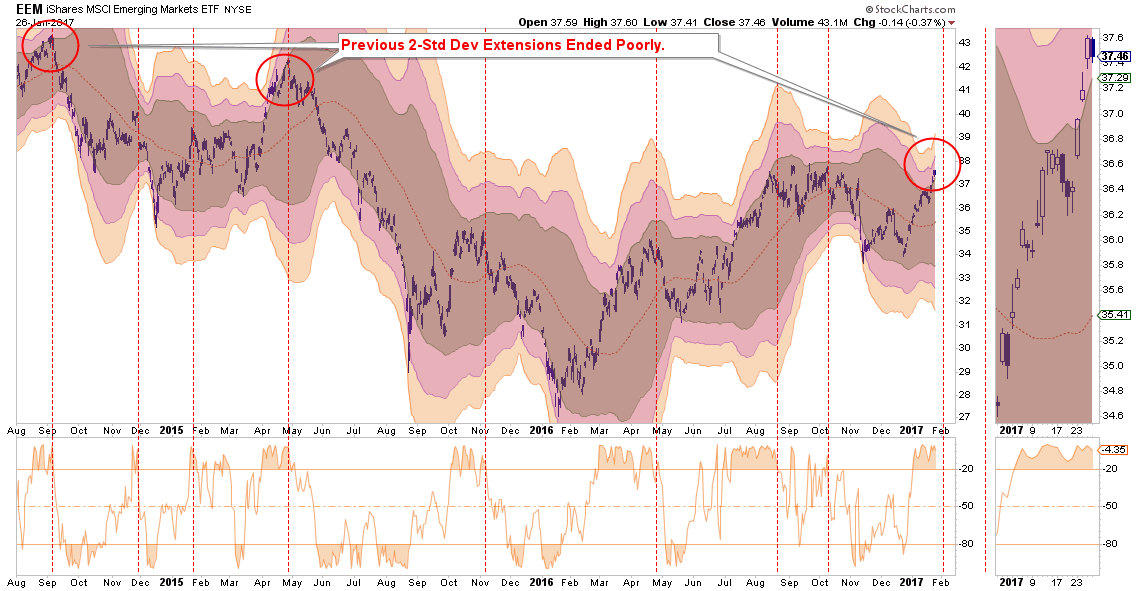
EMERGING MARKETS
Emerging markets have had a very strong performance as of late and are now 3-standard deviations above the mean which is “rarefied air.” The strengthening of the US Dollar will weigh on the sector and will only get worse the longer it lasts. With the sector overbought, the majority of the gains in the sector have likely been achieved. Profits should be harvested and the sector under-weighted in portfolios. Long-term underperformance of the sector relative to domestic stocks continues to keep emerging markets unfavored in allocation models for now.
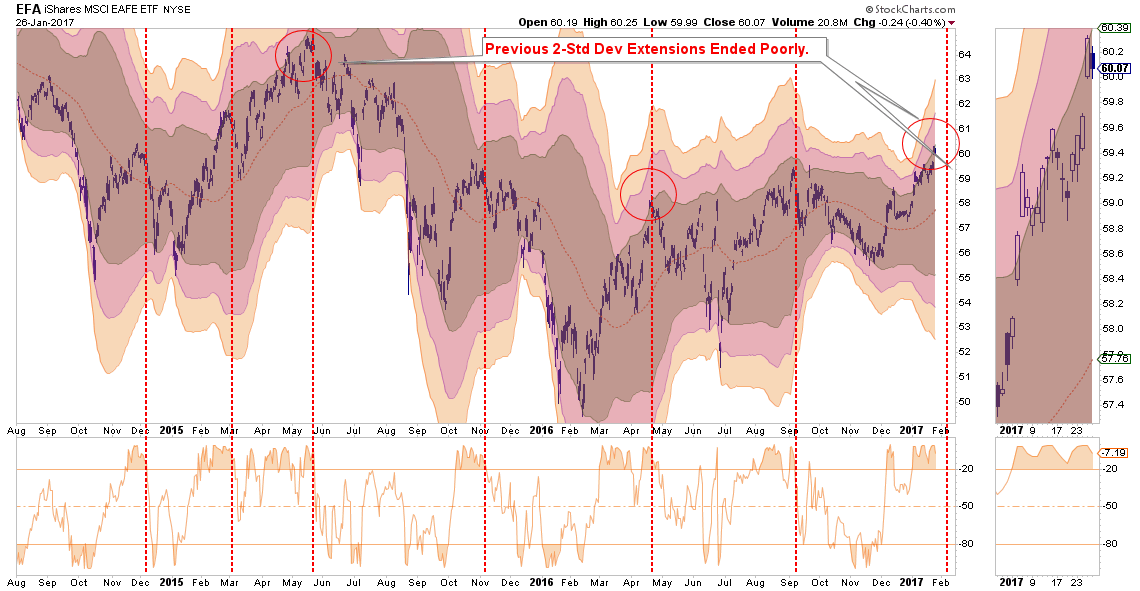
INTERNATIONAL MARKETS
As with Emerging Markets, International sectors also remain extremely overbought and unfavored in models due to the long-term underperformance. Underweight the sector, take profits, and focus more on domestic sectors for now.
DOMESTIC MARKETS
As stated above, the S&P 500 is extremely overbought, extended and exuberant. However, while a “buy signal” is currently in place, a sell signal registered from such a high level has previously coincided with bigger corrections.
Caution still advised for now.

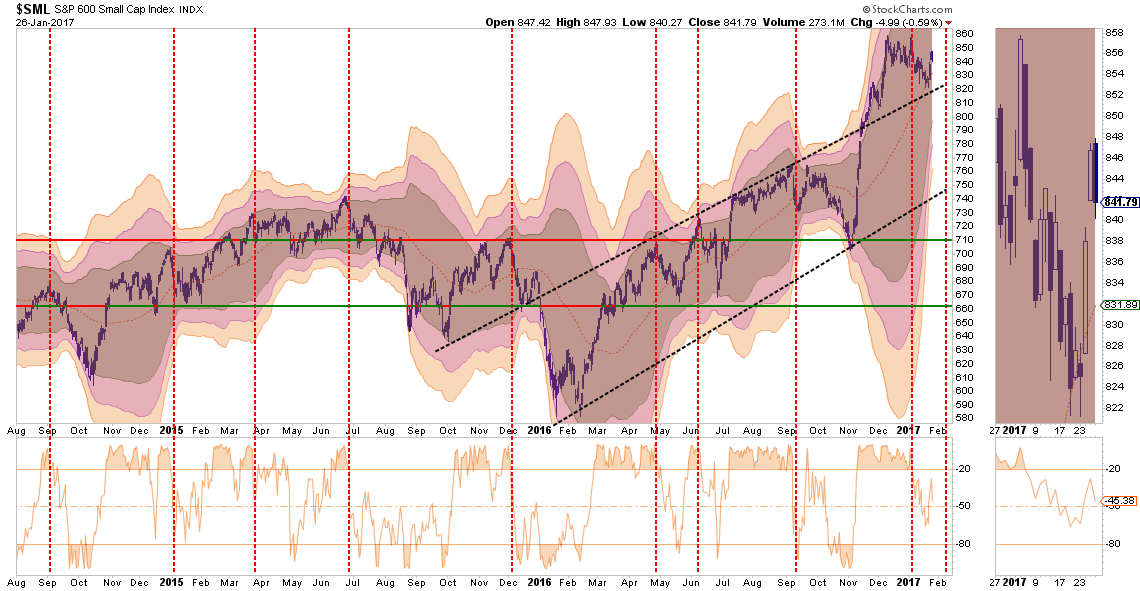
SMALL CAP
Small cap stocks went from underperforming the broader market to exploding following the Trump election. With the index bouncing off the bullish uptrend line recently, a break out to new highs could signal a continued move higher.
Currently, small caps are between overbought and oversold which suggests the current corrective process is likely not complete yet. Reduce exposure back to portfolio weight for now and carry a stop at $820.
MID-CAP
As with small cap stocks above, mid-capitalization companies having a rush of exuberance. However, Mid-caps currently remain extremely overbought. Reduce exposure back to portfolio weight for now and carry a stop at $1660.

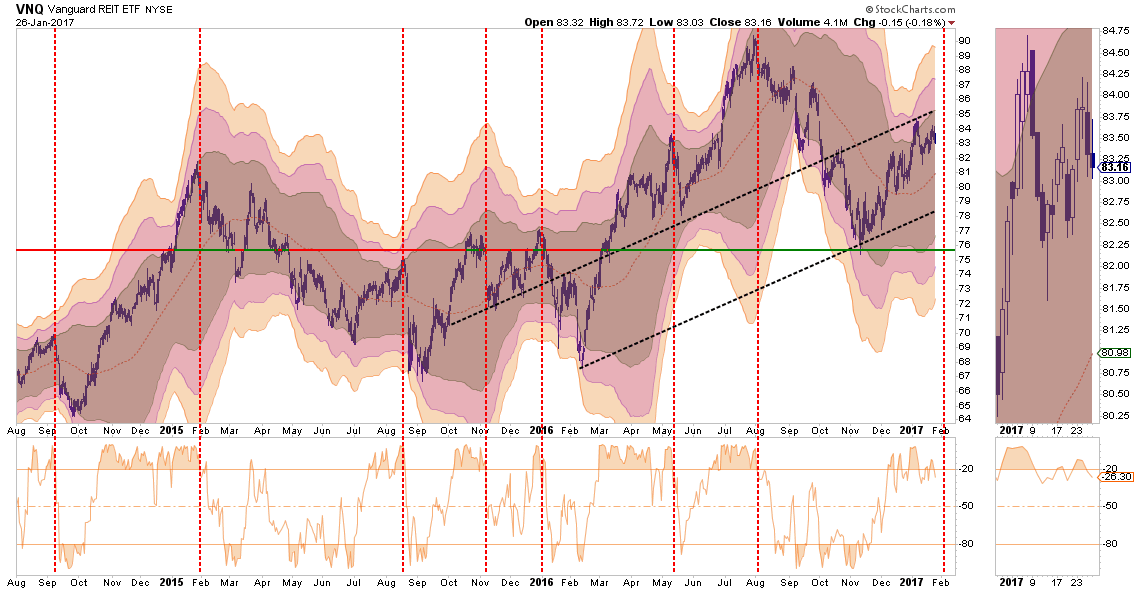
REIT’s
REIT’s had been under pressure heading into the election. However, since then there has been a nice reversal of performance for the sector. However, when rates begin to reverse as “risk” rotates back into “safety,” the risk-reward setup to add REIT’s to portfolios is positive. Positions can be added on a pullback to support at $81 with a stop set at $78.
IMPORTANT NOTE:
If you go back through all the charts and note the vertical RED-DASHED lines, you will discover that each time previously these lines denoted the peak of the current advance. Overall, in the majority of cases above, the risk/reward of the market is NOT favorable.
If, and when, the market corrects some of the short-term overbought conditions which currently exist, equity risk related exposure can be added back to portfolios.
Just be cautious for the moment.
It is much harder to make up losses than simply adding preserved cash back into portfolios.
#PortfolioHedgesMatter
Market & Sector Analysis
Data Analysis Of The Market & Sectors For Traders
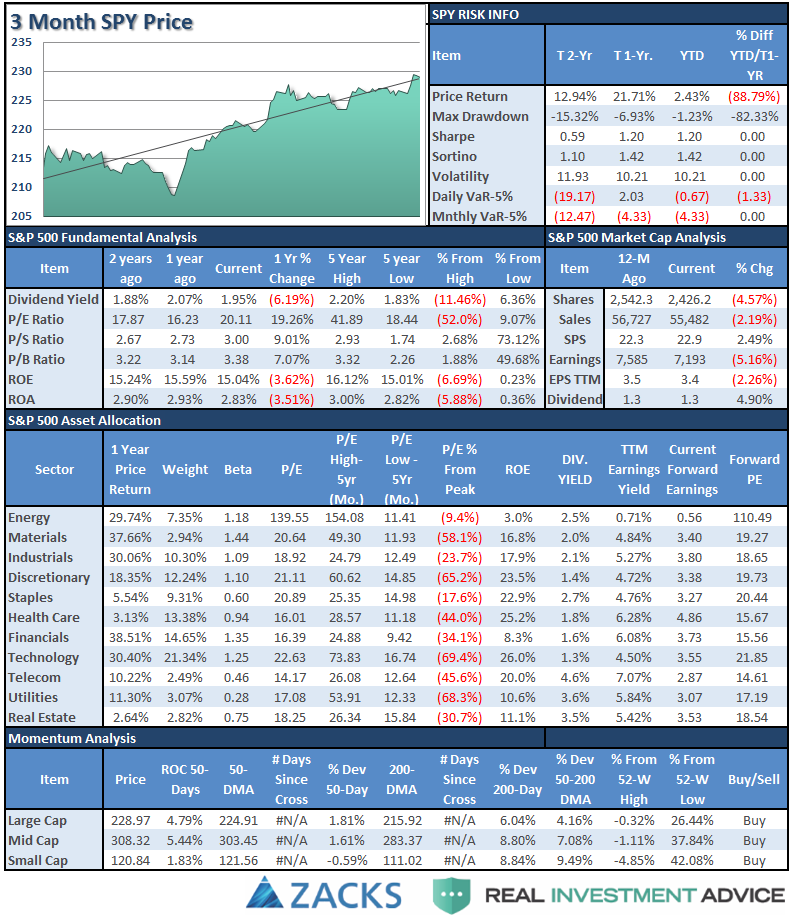
S&P 500 Tear Sheet
The “Tear Sheet” below is a “reference sheet” provide some historical context to markets, sectors, etc. and looking for deviations from historical extremes.
If you have any suggestions or additions you would like to see, send me an email.
Sector Analysis
Comments
Please see the main body of the missive above for a sector-by-sector analysis.
However, I will update the sector rotation model from last week.
The rotation is now happening.
Pay attention. These rotations usually are early indicators of a “risk off” transition.

This rotation is likely very early in its movement. As I have been pointing out over the last several weeks, the bifurcation of “risk” vs. “safety” was pushing extremes. Historically, the rotation from “risk on” to “risk off” has generally not been a smooth one.
Everything is currently pointing to this being a very late stage advance, so profit taking, hedging, and rebalancing remains strongly advised.
THE REAL 401k PLAN MANAGER
The Real 401k Plan Manager – A Conservative Strategy For Long-Term Investors
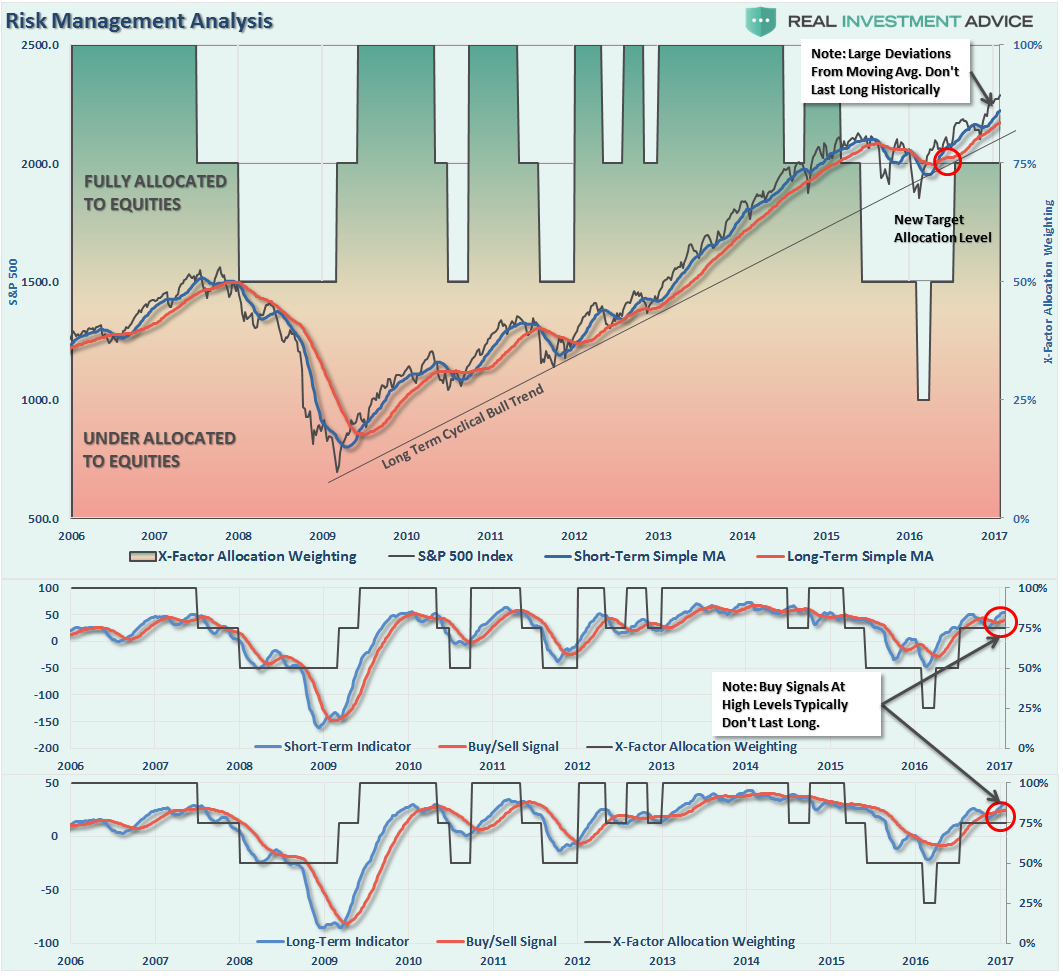
There are 4-steps to allocation changes based on 25% reduction increments. As noted in the chart above a 100% allocation level is equal to 60% stocks. I never advocate being 100% out of the market as it is far too difficult to reverse course when the market changes from a negative to a positive trend. Emotions keep us from taking the correct action.

Trump – Week One
The first week of office for President Trump has been one of rapid action. From immigration, to building “The Wall,” the initial steps of the ACA repeal, and promises of infrastructure spending sent the markets higher this past week. That’s the good news and as I noted last week:
“I would NOT be surprised for the markets to have a “relief rally” next week and make a push for ‘Dow 20,000.'”
Well. That happened. So, what next?
While there really isn’t any “bad news” to speak of, the extension of the market remains extreme. As noted above, we are in the early stages of a “risk off” rotation which suggests a mild correction is likely in store as we head into February.
With buy signals on all three indicators registered currently, any corrections are likely to be somewhat limited back to the rising short to intermediate-term moving averages.
This would suggest a correction back to 2200 on the S&P 500 would likely be a “buyable” trading level. As noted in the chart above, the current extension above the moving average will likely be corrected in fairly short order. Such a correction will relieve some of the extreme overbought conditions that currently exist and allow for additional risk exposure in portfolios if needed.
As noted in the main body of this week’s missive, the current extremes on many fronts suggest investment risk remains elevated which is why I have not increased the allocation model to 100% as of yet. This is also why I have suggested over the last couple of weeks to use this current advance, and extension, as an opportunity to clean up portfolios. (Use guidelines noted previously.)
- Tighten up stop-loss levels to current support levels for each position.
- Hedge portfolios against major market declines.
- Take profits in positions that have been big winners
- Sell laggards and losers
- Raise cash and rebalance portfolios to target weightings.
If we can get a correction that resolves the overbought, extended and excessively bullish backdrop to the markets currently, I WILL increase the allocation model to 100%. For now, we will wait and let the markets tell us what it wants to do next.
If you need help after reading the alert; don’t hesitate to contact me.
Current 401-k Allocation Model
The 401k plan allocation plan below follows the K.I.S.S. principal. By keeping the allocation extremely simplified it allows for better control of the allocation and a closer tracking to the benchmark objective over time. (If you want to make it more complicated you can, however, statistics show that simply adding more funds does not increase performance to any great degree.)

401k Choice Matching List
The list below shows sample 401k plan funds for each major category. In reality, the majority of funds all track their indices fairly closely. Therefore, if you don’t see your exact fund listed, look for a fund that is similar in nature.

Disclosure: The information contained in this article should not be construed as financial or investment advice on any subject matter. Streettalk Advisors, LLC expressly disclaims all liability in ...
more

