
Key Ratios - Emerging Megatrends 2018
In 2017, commodity prices slumped to a 50-year low compared to US stocks. Over the last 100 years, that low ratio happened only twice. And as we begin 2018, the SPY continues to increase in value.
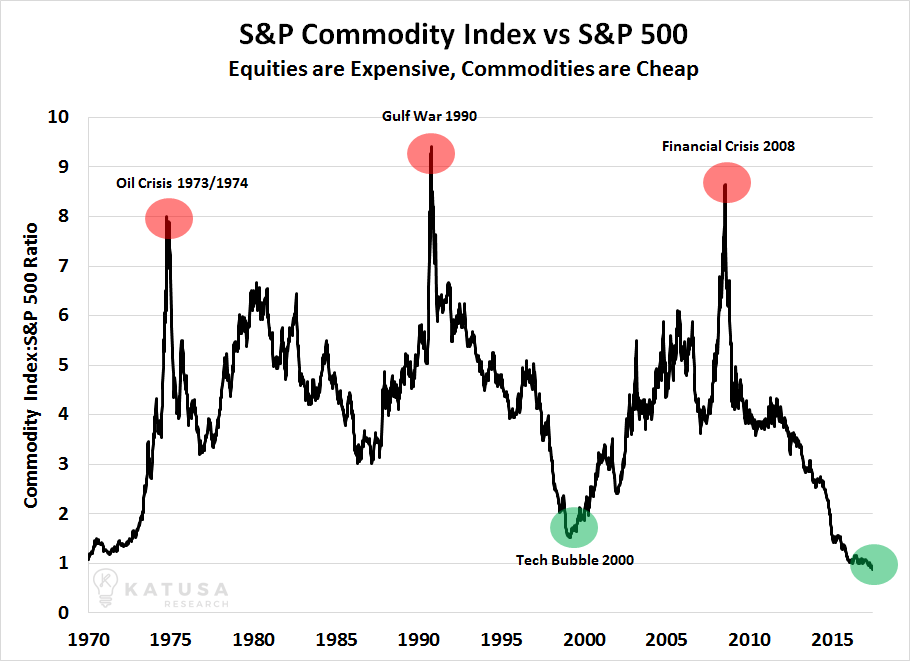
Do commodities love a crisis?
War, financial meltdowns, environmental disasters, coups - these are the top reasons commodities rally and create a potential hyperinflationary environment.
If we accept that as true, then what could possibly reverse this historically low relationship?
After all, the market fear factor indicates virtually zero fear that any of these crises can happen anytime soon.
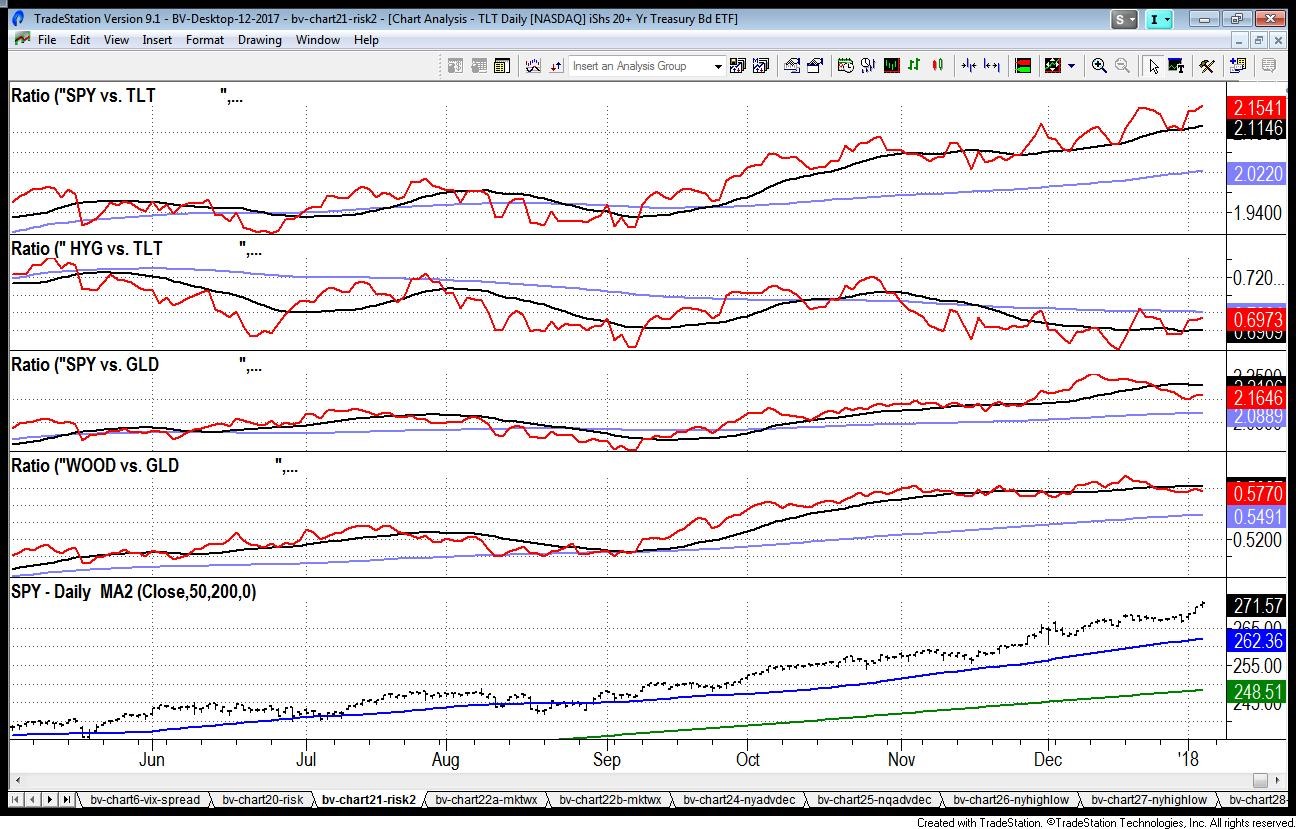
This chart, part of MarketGauge’s BigView Indicators, was updated as of the close of January 4th.
The four Risk On/Off confirmation indicators are as follows:
SPY vs TLT - This ratio measures the relationship between what is considered to be the safest debt instrument (U.S. bonds) versus the benchmark stock index, the S&P 500. When the ratio is trending up and the distance between the ratio and the moving average widens, it identifies an increased appetite for risk in the market. Bullish.
HYG vs TLT - This ratio measures the relationship between risky high yield corporate debt (HYG) versus the safety of U.S. Bonds (TLT). When the ratio is trending up and the distance between the ratio and the moving average widens, it identifies an increased appetite for risk in fixed income markets.
SPY vs GLD - This ratio measures the relationship between the S&P 500 (SPY) and Gold (GLD).
When the ratio is trending up and the distance between the ratio and the moving average widens, it generally identifies an increasing appetite for risk and is viewed as favorable to stocks.
WOOD vs GLD - This ratio measures relationship between gold (GLD) and lumber (WOOD). When this ratio is trending up it indicates that the relative performance of lumber is improving versus gold.
Lumber is a key input into construction which tends to increase in strong or improving economic conditions. When the ratio is trending up and the distance between the ratio and the moving average widens, it serves as a good risk-on indicator.
How to Read These Charts
The red line is the actual daily value of the ratio. The blue moving average represents a 6-month average of the ratio and the black line represent 4-week moving average of the ratio.
How to Use the Ratio Indicators:
When the daily value of the ratio (red line) is over the black (4 weeks) moving average, it is considered bullish for U.S. equities or a "Risk On" environment. We use the same concept for longer term readings and confirmation of the shorter term reading by looking at the ratio relative to its 6-month moving average.
The Lower Chart - This is a daily chart of S&P 500 ETF (SPY) with a simple 50-day (blue), and 200-day (green) moving average. Tres Bullish.
Currently, the red line is over the black line in both the SPY vs. TLT and HYG versus TLT charts. Bullish for equities.
The red line is below the black in both the SPY v. GLD and Wood v. GLD charts.
When paired with the fist chart of the overall commodities index versus the SPY, the potential emerging reversal of the historically low trend is easy to time your way into.
For starters, if the distance between the red and black line matters, we will look for that distance to narrow or widen.
Even if the first 2 charts do not reverse at the same point when and if the last 2 charts reverse (red over black), watch to see if the black narrows in relationship to the red.
Then, we will look for the last 2 charts to do the opposite. We watch for the red to cross over the black and the distance between the two lines to widen.
Noteworthy is the Wood:Gold chart. Lumber is beginning to wane compared to gold. As mentioned, the best economic scenario is for wood to outperform gold.
Finally, still favorable to stocks, the Gold to SPY ratio shows the distance between the red and the black lines narrowing. Once the red reverses back over the black, especially along with Wood declining relative to gold, the timing for a major reversal of commodities versus stocks could prove the best investment for 2018.
S&P 500 (SPY) What a first week of the year. Will it continue? Better question, what is the best place to park new money?
Russell 2000 (IWM) Through 155 should go higher, especially on a closing basis. Under 153.50 trouble
Dow (DIA) Runaway gap holding 249.22. No Terror at 25k at this point. I expect that the meltup is just beginning.
Nasdaq (QQQ) 160 pivotal as this makes new all-time highs.
Disclosure: None.


