
Is The Market On The Naughty List?

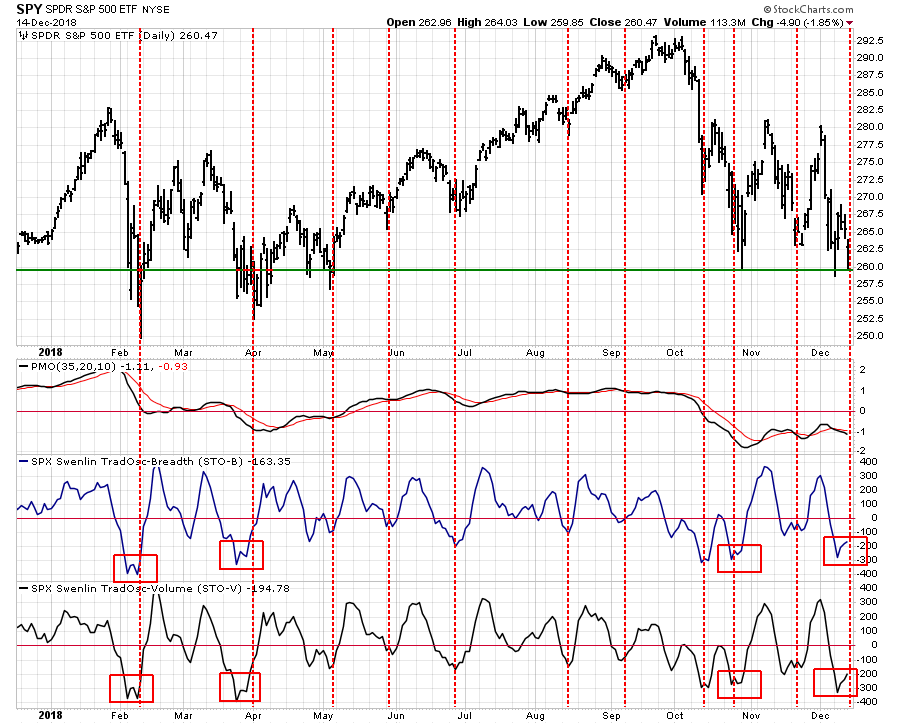
Two weeks ago, I warned that the “G-20 rally” had exhausted a bulk of the“oversold” condition which had existed at that time. I also recommended remaining cautious until the underlying technical backdrop had improved. While that turned out to be very good advice, the market is now reversed from where it was then. Markets are back to deeply oversold conditions and are sitting on important support. As shown in the chart below, these conditions have been previously present when markets have bounced.
On Tuesday, we discussed the potential for a “Santa Claus” rally as we head into the end of the year. In case you missed it, here was the important takeaway of that discussion:
“The following graph shows, in orange, aggregate cumulative returns by day count for the 28 Decembers we analyzed plotted alongside daily aggregated average returns by day.”
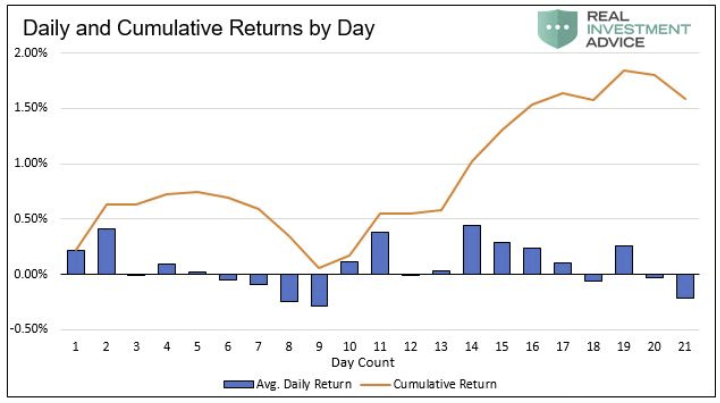
“IF ‘Santa’ is going to visit ‘Broad & Wall’ this year, it will most likely occur between the 10th through the 17th trading days of the month. Such would equate to Friday, December 14th through Wednesday, December 26th.”
While the current oversold condition is supportive of a rally over the next couple of weeks, that does not mean this is a “stocking” you should stuff everything into. Given the macro-backdrop, any rally may be short-lived going into 2019 unless some of the pressure from weaker economic data, Brexit, Washington politics, “trade wars”, balance sheet reductions, and softer-earnings growth is relieved.
So far, such relief has yet to be the case as economic data both globally and domestically continues to weaken. As noted on Friday, this weakness is occurring at a time where the Federal Reserve continues to extract liquidity from the market. To wit:
“While the Fed’s rate hikes do indeed raise borrowing costs and slow economic growth, it is the extraction of liquidity from the markets which is most important. As shown in the chart below, the Fed is now reducing their flows by $50 billion each month. This is in direct contrast to the billions they were injecting previously which corresponds with the markets decade-long bull market despite weak revenue growth due to a sluggish economic expansion.”
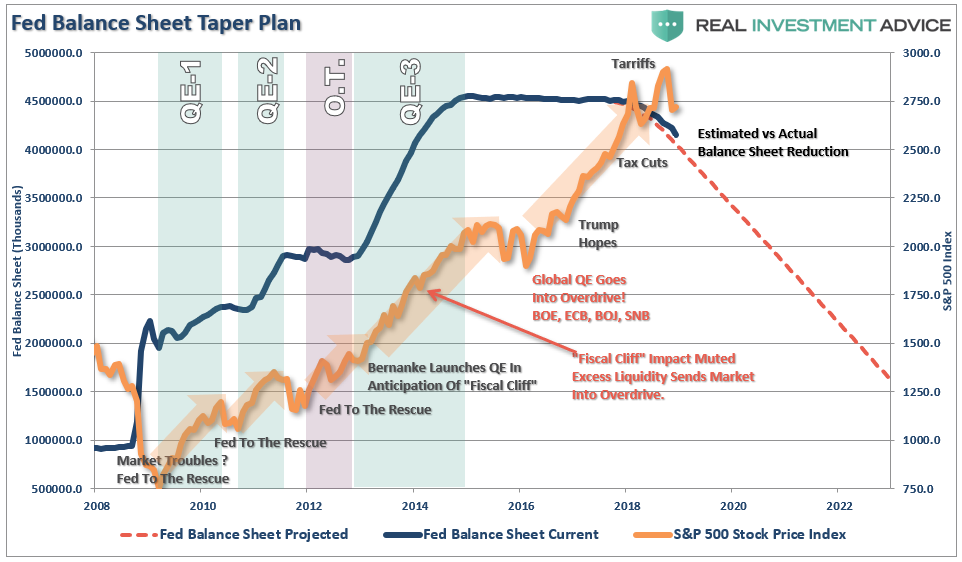
“But it is no longer just the Fed. On Thursday, the European Central Bank made two important announcements.
- They will stop adding to its stock of government and corporate bonds at the end of December, and;
- They are seeing signs of weaker inflation and economic growth.
In other words, as world markets are beginning to struggle as the driver of the decade-long bull market is being removed.”
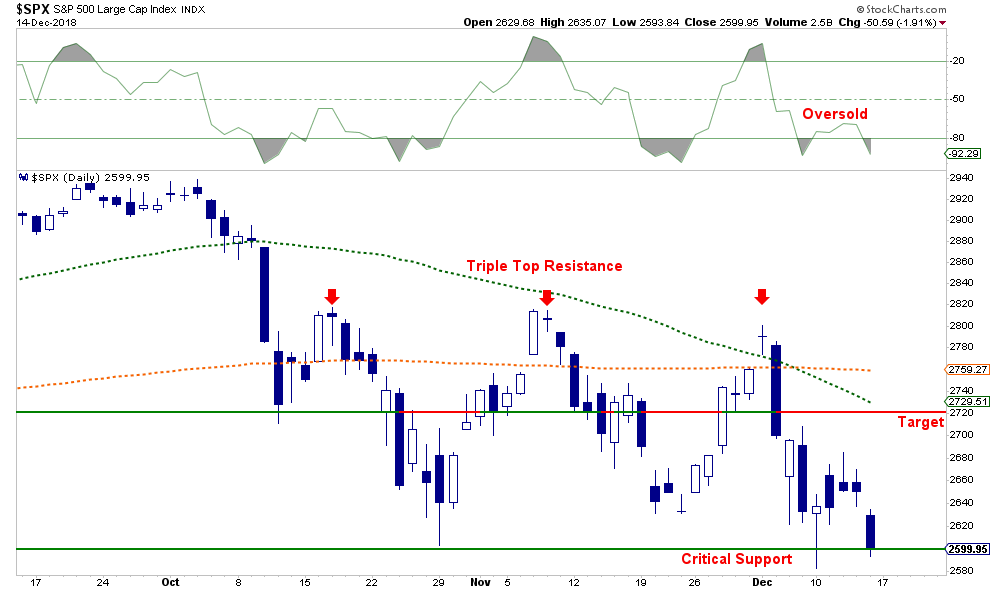
Last week, as we noted at RIA PRO, we put on a small S&P 500 (IVV) trading position for a potential oversold rally. As I noted on Friday, that trade has left much to be desired as the market simply has not been able to muster a sustainable bounce. On Friday, the market closed right at critical support levels.
Given the Fed meets next week, we are going to give our trade just the smallest margin of movement currently for three reasons:
- The market is deeply oversold which will contribute to a bounce on any bit of good news.
- The index closed lower than where it opened for 4-consecutive days. Such selling is often met with a one or two day bounce.
- Lastly, as noted previously, distributions for mutual funds are now mostly complete and they have to rebalance portfolios before the end of the reporting year. With next week having the highest historical probability for a rally, a more “dovish” than expected Fed could spark a bit of buying frenzy.
While we are expecting an oversold rally, remember after having reduced exposure in portfolios previously, and carrying a much heavier weighting in cash, we are giving the market time to figure out what it wants to do. Given the consolidation range over the last couple of months, it is too risky to be either overly short, or aggressively long, currently. Cash remains the best hedge currently.
But let me repeat the most important point:
“The expected rally IS NOT the next version of the ‘bull market.’ Nor does a rally mean the ‘bear market’ is over. It will be a counter-trend rally to sell into.”
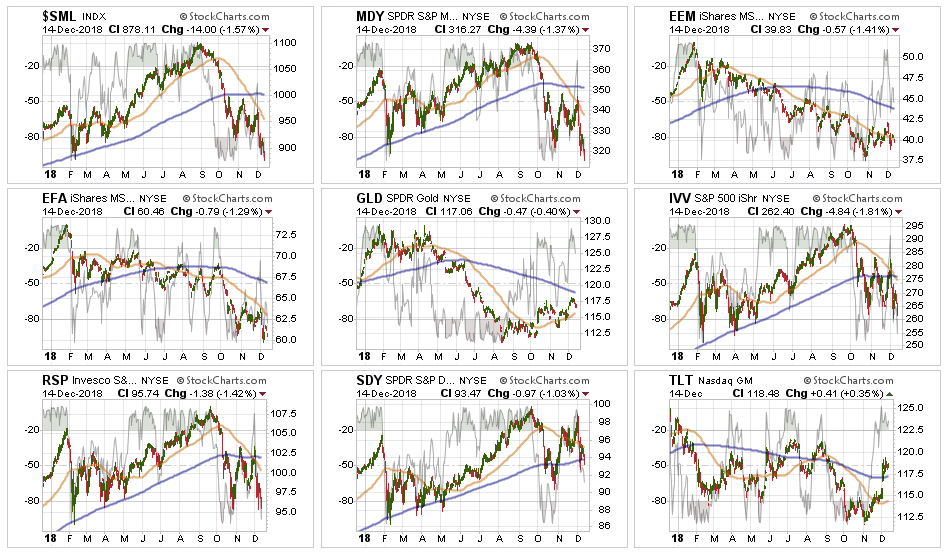
But it is not just the S&P 500 where this is occurring. As shown, every market is now trending negatively.
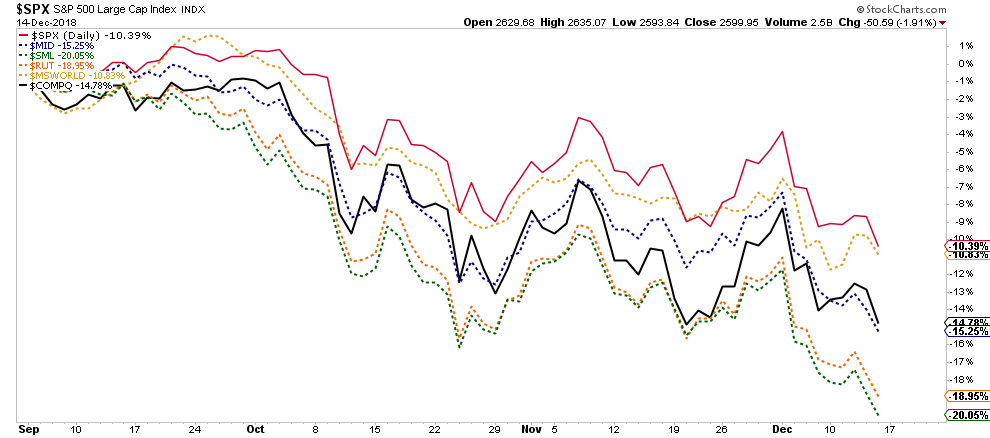
As I have noted previously, the weakness in the market continues to be a process that has gripped markets over the last several months as the Federal Reserve has steadily increased their extraction of liquidity. As shown in the chart above, the market has continued to build multiple tops as the 50-dma deepens its divergence from the 200-dma. Currently, downside stop losses are holding, but there isn’t much wiggle room here currently before further actions need to be taken.
While we are certainly hoping that Santa Claus will indeed come and visit “Broad & Wall” over the next two weeks, there isn’t much reason to take on an excessive amount of risk currently.
Lack Of Experience
A lot of my articles and newsletters get picked up and republished by great sites like Seeking Alpha, Advisor Perspectives, Equities.com, Investing.com, Zerohedge, and many others. What is interesting to read are the comments that are posted as they show the “lack of experience” most individuals have in the markets today.
But such shouldn’t surprise you. Roughly 70% of Americans have very little or no participation in the financial markets currently. Even more than that have little or no understanding about how markets and investing actually work. Lastly, given that most don’t survive bear markets, most individuals in the markets today started their investing journey after 2008.
My investing journey started prior to 1987 and this note by Carl Swenlin at Decision Point (h/t Mr. Obrien) put a fine point on the single biggest problem which exists currently.
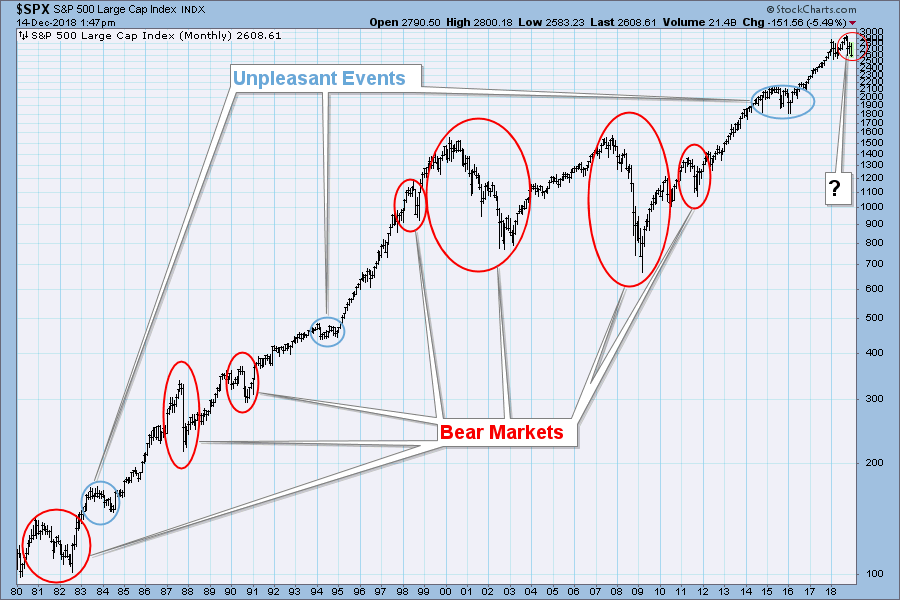
“The chart below shows the entire period during which I have been involved in stock market analysis, and, as you can see, the title of this article definitely does not apply to me. If a decline of -20% or more qualifies as a bear market, then I have experienced seven of them. Additionally, there were three periods which, while not qualifying as bear markets, were sufficiently unpleasant to qualify them for ‘honorable mention.’ I have identified the current decline with a question mark, because we won’t know if it qualifies as a bear market until the benchmark -20% decline is in; however, bear market evidence continues to appear, and I believe we’re in a bear market now.”
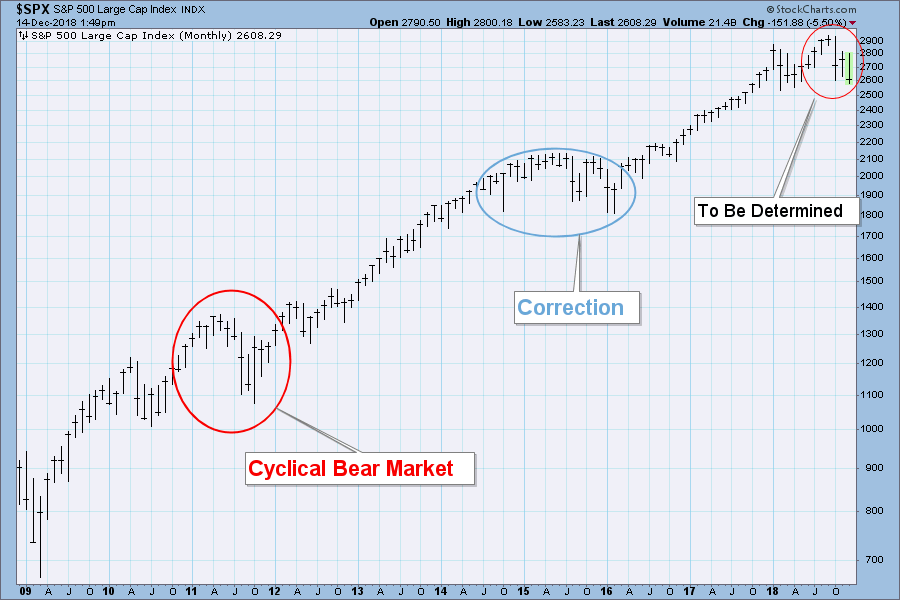
“By comparison, anyone with 10 years experience in the market has only seen the 2011 baby bear and a mild correction. A person with such limited experience is at a serious disadvantage.”
“I was going to say that he/she cannot imagine what lies ahead in a real bear market, but that would be wrong. Using technical analysis, a determined individual can study past bear markets and imagine very well what the experience might have been like. In particular, apply favored indicators to bear market periods and observe how they behave.”
Here is the important point, if you have never been through a real “bear market,” it is a lesson which you DO NOT want to learn the “hard way.”
It is always better to err to the side of caution with your hard earned savings than to try and replaced both lost capital and time. As I noted in the “Exit Problem:”
“The markets function much the same way as yelling ‘fire’in a theater filled to capacity with only one exit. Those closest to the exit will likely get out safely, but once the ‘bottleneck’ forms, there is an inability to exit before the damage is done.”
It is likely no longer the time to remain fully invested in the financial markets without a thorough understanding of your “risk exposure.” Most likely, returns over the next decade will be far worse than those in the last.
As I have stated often, my job is to participate in the markets while keeping a measured approach to capital preservation. Since it is considered “bearish” to point out the potential “risks” that could lead to rapid capital destruction; then I guess you can call me a “bear.”
Just make sure you understand I am still in “theater,” I am just sitting much closer to the “exit.”
Market & Sector Analysis
Data Analysis Of The Market & Sectors For Traders
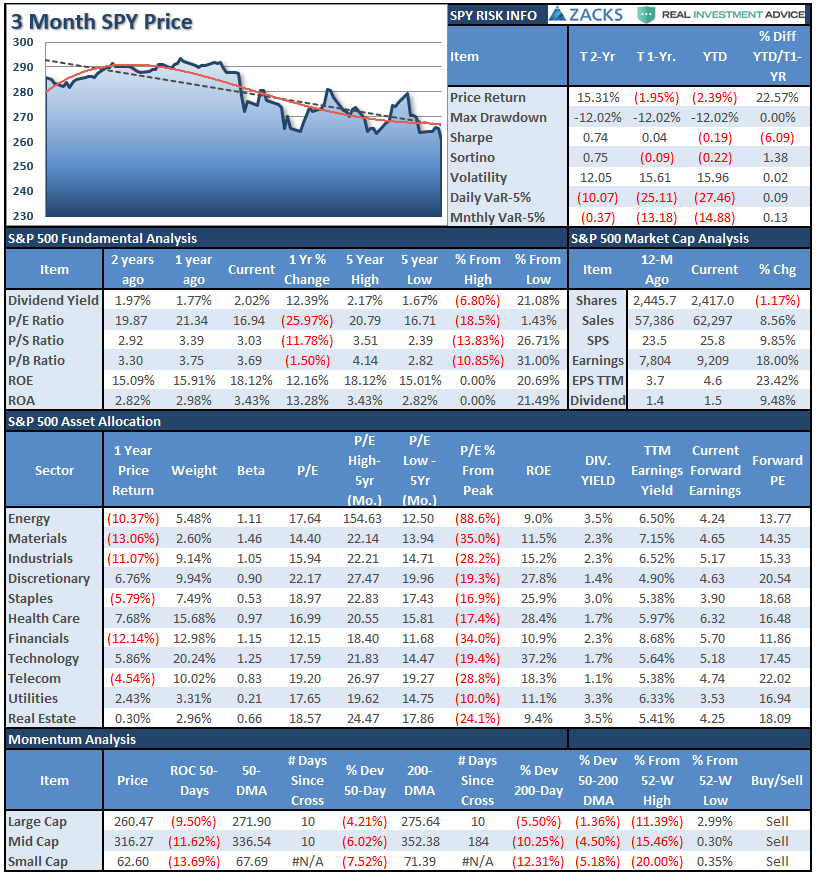
S&P 500 Tear Sheet
Performance Analysis
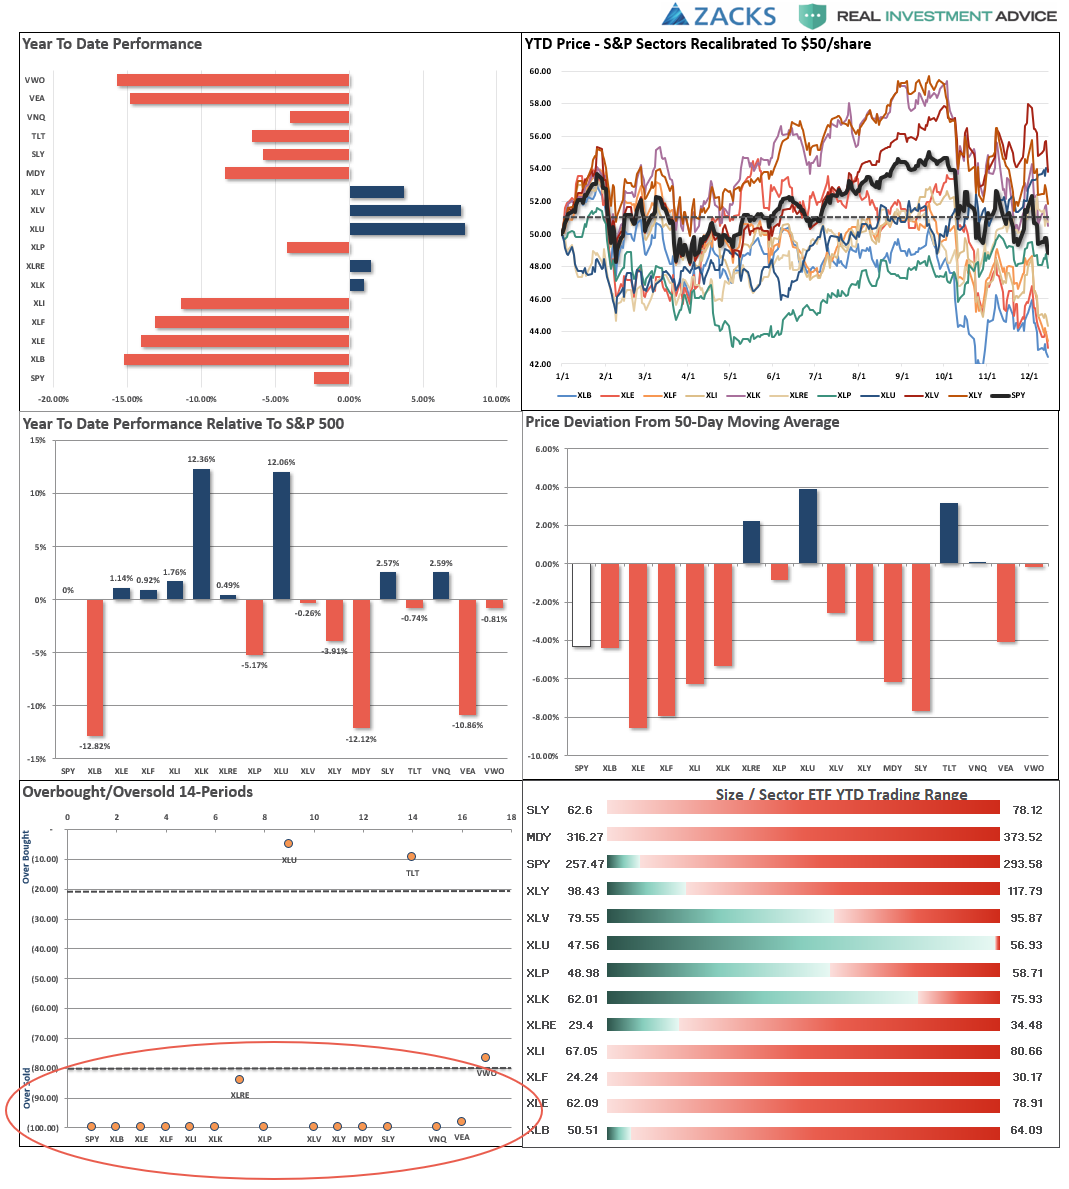
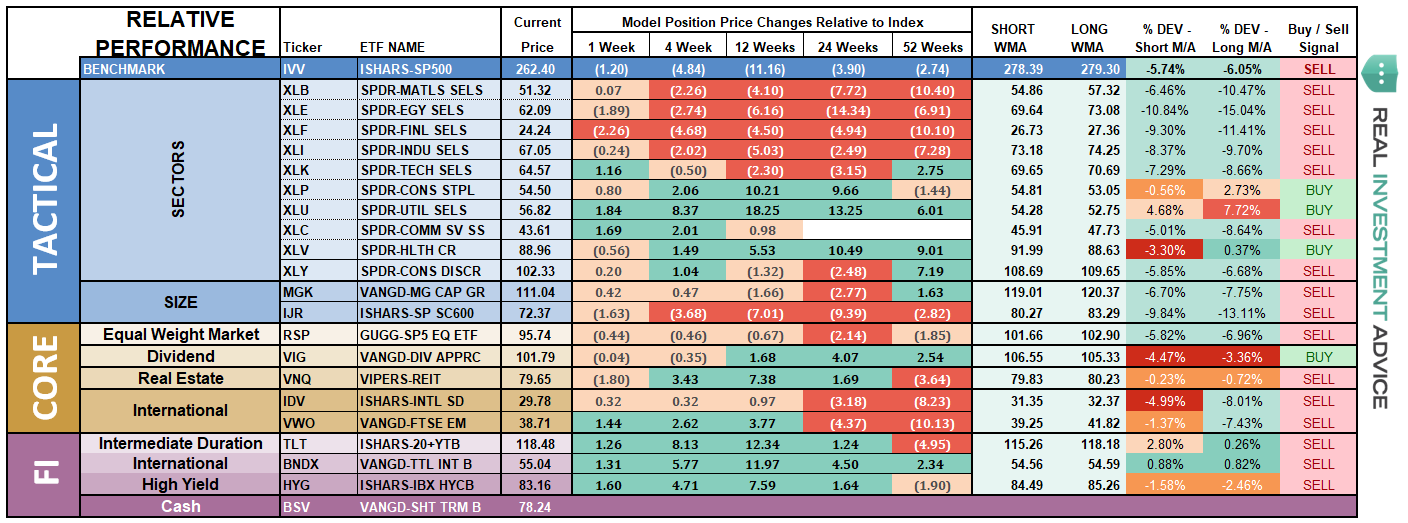
ETF Model Relative Performance Analysis
Sector & Market Analysis:
Sector-by-Sector
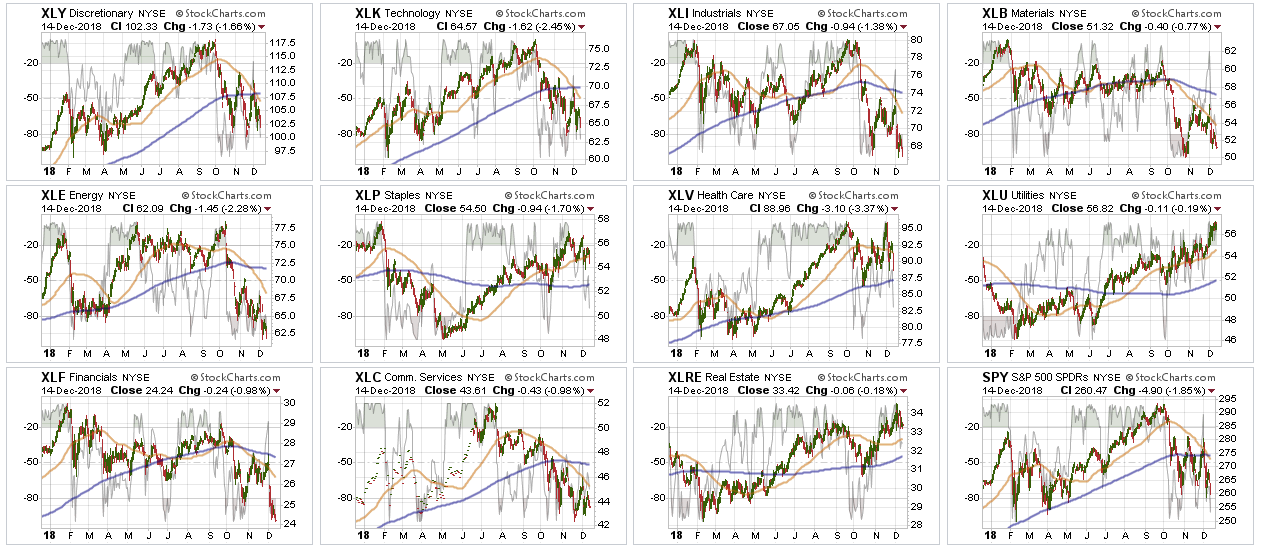
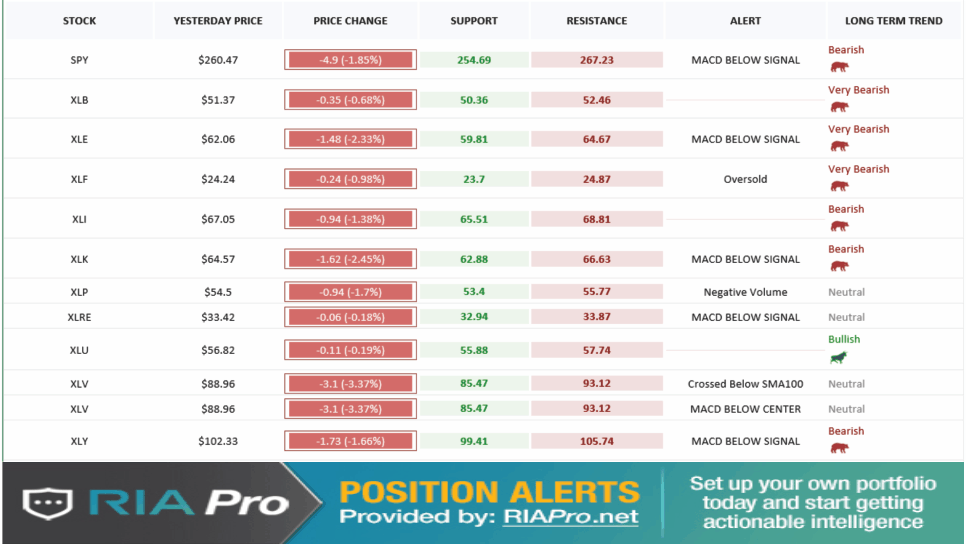
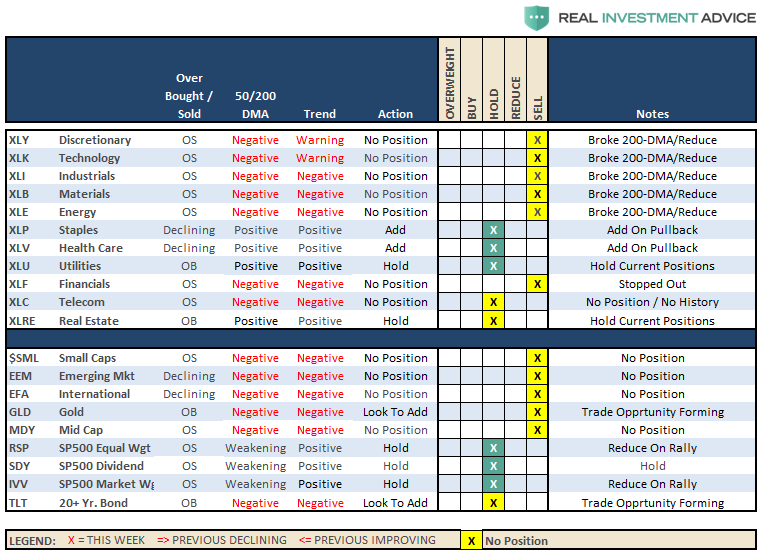
Discretionary and Technology sectors are both testing multiple bottoms currently within a defined downtrend. After having removed all of our excess holdings in these sectors earlier this year, there is no reason currently to take on additional exposure. Reduce holdings on any rally into the end of the year.
Industrials, Materials, Energy, Financials, Communications – we are currently out of all of these sectors as the technical backdrop is much more bearish. With all of these sectors below their respective 50- and 200-dma’s, the downside pressure remains on for these sectors for now particularly as Industrials and Energy have broken recent bottoms to new lows for the year. The ongoing “trade war” and flattening yield curve continues to weigh on the outlook for these sectors. Continue to reduce weightings markedly on rallies.
Real Estate, Staples, Healthcare, and Utilities continue to be bright spots as “defensive” sectors. However, Staples and Healthcare have recently been hit with a bout of profit taking pushing both below their 50-dma. Real Estate and Utilities remain strong and are overbought currently. We continue to remain long staples and healthcare specifically but we are watching them closely. With trends still positive a trading opportunity may be presenting itself but we need to see the whole market “get its act together” next week.
Small-Cap and Mid Cap – both of these markets are currently on macro-sell signals and have broken to new lows for the year. We closed out our holdings in these sectors earlier this year but with both of these markets oversold look for a rally next week to sell into.
Emerging and International Markets -As suspected, emerging markets failed to hold above the 50-dma again last week and continues along its entrenched downtrend. International markets still look terrible and no improvement is being made there either with the index breaking to new lows last week. With major sell signals in place currently, there is still no compelling reason to add either of these markets to portfolios at this time.
Dividends, Market, and Equal Weight – Not surprisingly, given the rotation to “defensive” positioning in the market, dividend-based S&P Index continues to outperform other weighting structures. All three sold off last week as downward pressure was broad-based across all sectors. The overall market dynamic remains negative for now and important supports are being tested.
Gold – Gold has continued to trend along a rising 50-dma but is currently very overbought. If we get a rally in the markets next week, look for gold to retest support at the 50-dma. Such a retest will give traders an opportunity to add exposure with stops raised to $113.
Bonds – continued to outperform last week as a search for safety continues. Currently, bonds are very overbought which likely suggests a pullback is coming which would coincide with a rally in the stock market. However, such a pullback will likely provide a good buying opportunity as evidence of broader economic weakness continues to mount. We remain long our core bond holdings for capital preservation purposes and will look for a trading opportunity which does not violate the 200-dma.
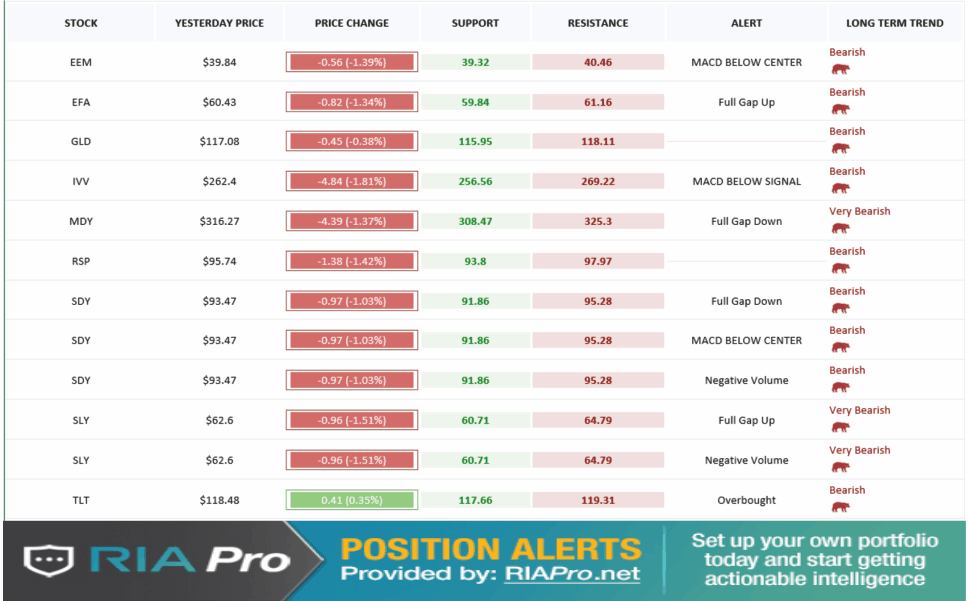
The table below shows thoughts on specific actions related to the current market environment.
(These are not recommendations or solicitations to take any action. This is for informational purposes only related to market extremes and contrarian positioning within portfolios. Use at your own risk and peril.)
Portfolio/Client Update:
As noted previously, the overall market action remains troubling to say the least. The bullish trend, longer-term, remains intact for now, but the bearish backdrop continues to mount. We continue to sit on our hands with current positions and overweights in both cash and fixed income.
Last week, we took on a small trading position across models with an S&P 500 indexed ETF (IVV) in anticipation of an oversold rally into year-end. So far, it has not worked as planned and will be closed out next week on any rally heading into the Federal Reserve announcement on Thursday.
Despite all the volatility this year, the market is still within an overall consolidation pattern with Q1 lows still intact. Therefore, it is not yet viable to short the broader market. That time is coming, but shorting has capital risk just like being long. Given the recent uncertainty of the market, the best “hedge” remains cash for now.
While we expect a rally next week from short-term oversold conditions, we will remain on hold with any actions.
- New clients: We will continue to hold existing positions and sell “out of model” holdings on rallies.
- Equity Model: We will continue to hold current positions which are mostly 1/2 weights. Stops have been dramatically tightened up.
- Equity/ETF blended – Same as with the equity model.
- ETF Model: We will hold current holdings for now.
Again, we are moving cautiously. There is mounting evidence of short to intermediate-term risk of which we are very aware. However, with the market moving into the seasonally strong period of the year, we realize that short-term performance is just as important as the long-term. It is always a challenge to marry both.
It is important to understand that when we add to our equity allocations, ALL purchases are initially “trades” that can, and will, be closed out quickly if they fail to work as anticipated. This is why we “step” into positions initially. Once a “trade” begins to work as anticipated, it is then brought to the appropriate portfolio weight and becomes a long-term investment. We will unwind these actions either by reducing, selling, or hedging, if the market environment changes for the worse.
THE REAL 401k PLAN MANAGER
The Real 401k Plan Manager – A Conservative Strategy For Long-Term Investors
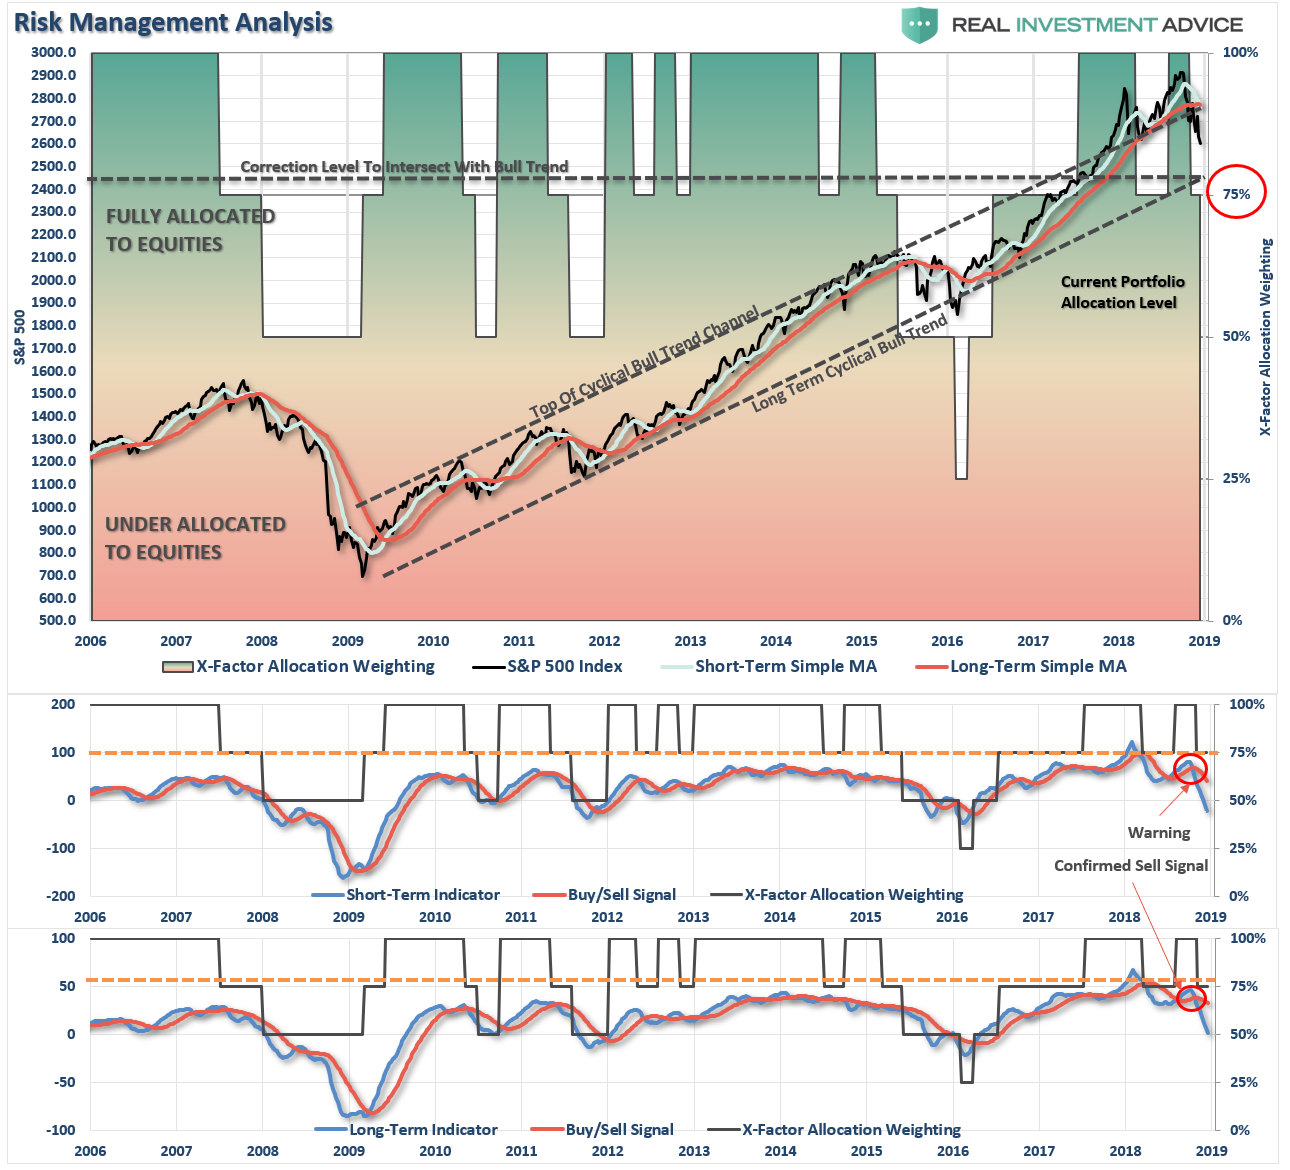
There are 4-steps to allocation changes based on 25% reduction increments. As noted in the chart above a 100% allocation level is equal to 60% stocks. I never advocate being 100% out of the market as it is far too difficult to reverse course when the market changes from a negative to a positive trend. Emotions keep us from taking the correct action.

Bull Failure
Last week, the bulls failed to gain control of the market. Early morning bounces were meet with selling each day last week.
The overall market environment remains difficult and dangerous.
Once again, it is critically important for the “bulls” to try and rally the market next week. As I noted last week:
“It is important to recognize that markets are generally optimistically biased and looks for ‘reasons’ to rally regardless of whether there is real ‘merit’ to it.”
With the Fed on deck, and Trump in a corner, watch for more “dovish” comments to come from the Fed about potential policy changes with respect to stopping rate hikes. Also, it would not surprise me to start to hear more commentary from Washington about backing off some of the “trade rhetoric” with China.
Any of this would like push markets higher from deeply oversold conditions.
Given the markets remain extremely range bound, we are maintaining our current weightings in our 401k plans for now until we get confirmation about what the markets want to do next. However, with confirmed “sell signals” in place, defense remains our primary strategy for 401k-plans currently.
Continue to use rallies to reduce risk towards a target level with which you are comfortable. Remember, this model is not ABSOLUTE – it is just a guide to follow.
- If you are overweight equities – reduce international, emerging market, mid, and small-capitalization funds on any rally next week. Reduce overall portfolio weights to 75% of your selected allocation target.
- If you are underweight equities – reduce international, emerging market, mid, and small-capitalization funds on any rally next week but hold everything else for now.
- If you are at target equity allocations hold for now.
Unfortunately, 401k plans don’t offer a lot of flexibility and have trading restrictions in many cases. Therefore, we have to minimize our movement and try and make sure we are catching major turning points. Over the next couple of weeks, we will know for certain as to whether more changes need to be done to allocations as we head into the end of the year.
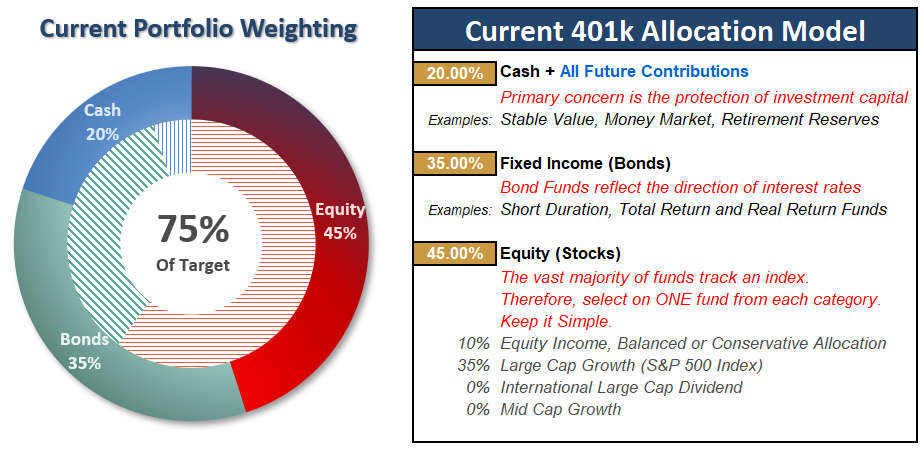
Current 401-k Allocation Model
The 401k plan allocation plan below follows the K.I.S.S. principle. By keeping the allocation extremely simplified it allows for better control of the allocation and a closer tracking to the benchmark objective over time. (If you want to make it more complicated you can, however, statistics show that simply adding more funds does not increase performance to any great degree.)
401k Choice Matching List
The list below shows sample 401k plan funds for each major category. In reality, the majority of funds all track their indices fairly closely. Therefore, if you don’t see your exact fund listed, look for a fund that is similar in nature.

Disclosure: The information contained in this article should not be construed as financial or investment advice on any subject matter. Real Investment Advice is expressly disclaims all liability ...
more

