
Investment And Interest Rates III What Taylor Rule
This is getting out of hand. A recent post received too many high quality comments. I discuss the discussion some here.
The general view expressed in the discussion is that it sure looks as if non residential fixed capital investment as a percent of GDP expressed (nrfinvgdp) and nominal interest rates are positively correlated, because high non residential fixed capital investment caused the Fed Opem Market Committee (FOMC) to raise target interest rates.
The bit of evidence supporting this story is that the correlation is high also with the Federal Funds interest rate (ffi) which is basically whatever the FOMC wants it to be. This does not explain why the short term safe ffi is highly correlated with the rate on long term moderately risky Baa rated corporate bonds. Nor does it explain why the correlation of nrfinv/gdp and the Baa rate is even higher than the correlation of nrfinv/gdp and ffi.
One thing which I think has to be added to the old comment thread is that the correlation of nrfinv/gdp and ffi is much too high. It is easy to tell a story about why it is positive, but the fact that it is so very high does not correspond to the standard assumption about FOMC policy in conventional macroeconomic models.
That assumption is called the Taylor rule and is very very standard in the literature. The models are closed with the assumption that ffi is a function of lagged inflation and unemployment. This is alleged to be an empirical observation. Now the Taylor rule is not derived from an optimization problem — the standard assumption that private economic agents optimize is not extended to policy makers. Since the assumption that ffi follows a Taylor rule is not an assumption about objectives and rational maximization, I have long considered it to be the only equation in standard macro models which is not problematic.
Now I’m down to zero. The analysis below is very crude, but I think is a whole new problem for standard macro models.
OK the point is, again, the graph, now edited to highlight ffi
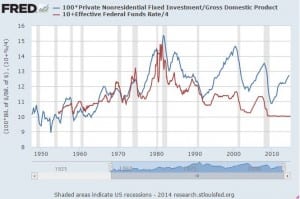
Here it is possible to see that the gap between the two curves has something to do with inflation. Also FOMC actions in the 1990s were very anomalous as widely noted a the time.
Now I want to treat the Taylor rule as a null hypothesis and ask if nrfinvgdp provides additional information about the next quarter’s average ffi (ldffunds) even when the unemployment rate (unem) and annual personal consumption deflator minus food and energy inflation (pcecinf) are considered. Since nrfinvgdp is available only quarterly, the regressions are all with quarterly data even though the other variables are available monthly.
First a standardish Taylor rule regression
This looks OK, the coefficient on lagged inflation is greater than one so persistently high inflation wpuld lead to a high real federal funds rate to fight inflation. High unemployment leads to a low Federal funds rate. Nothing odd here.
. reg ldffunds pcecinf unem
Number of obs = 218
R-squared = 0.6430
————-+——————————
ldffunds | Coef. Std. Err. t
pcecinf | 1.350626 .068801 19.63
unem | -.584172 .0944255 -6.19
_cons | 4.394535 .5839697 7.53
OK so does nrfinvgdp tell us more ?
. reg ldffunds nrfinvgdp pcecinf unem
Number of obs = 218
R-squared = 0.7338
ldffunds | Coef. Std. Err. t
nrfinvgdp | .9796746 .1146659 8.54
pcecinf | 1.150099 .0640077 17.97
unem | -.5265471 .0820059 -6.42
_cons | -7.384805 1.468441 -5.03
Sure looks like it does. The point estimate is nonresidential fixed capital investment 1 % of GDP higher is followed by a federal funds rate almost exactly 1% higher. This is a large coefficient to set to zero just because that’s what everyone does.
But wait, the Taylor rule was added to models in the 1990s IRRC. Here is the regression using only data 1994 and earlier
. reg ldffunds nrfinvgdp pcecinf unem if qtr<1995
Number of obs = 140
R-squared = 0.8017
ldffunds | Coef. Std. Err. t
nrfinvgdp | 1.895708 .1396259 13.58
pcecinf | .5171599 .0783395 6.60
unem | -.4975859 .0953061 -5.22
_cons | -15.4368 1.471012 -10.49
That’s crazy looking to someone used to conventional macro models. It’s empirical. The Taylor rule is supposed to be an empirical observation.
OK just playing around. I consider the conference board’s estimate of capacity utilization (caputil) — this was a popular series back before micro founded macro.
. reg ldffunds caputil pcecinf unem
Number of obs = 190
R-squared = 0.6497
ldffunds | Coef. Std. Err. t
caputil | .2168575 .0621619 3.49
pcecinf | 1.210117 .0857462 14.11
unem | -.1504134 .1589102 -0.95
_cons | -15.27707 5.658306 -2.70
It’s explanatory power totally outclasses that of the unemployment rate.
I conclude the Taylor rule is like all of the rest of it — a standard assumption made because it is standard in an inward looking self referential literature in which evidence is not allowed to have much of a role.
Disclosure: None.


